
Implementing Action Filter in Tableau Dashboard
When a user initiates an event, Tableau executes one or more actions. Your charts become dynamic and have extra information added to them.
We’ll go through the different kinds of filter actions in Tableau as well as how to design them and utilize them to add interactivity to your visualizations in this Blog post.
Learn comprehensive how to implement action filters in dashboards in our Tableau Training Course in Chennai at Softlogic Systems.
Action Filter in Tableau
One of the most widely used collections of business intelligence and data analytics tools utilized by several businesses globally is Tableau.
Tableau is a preferable choice because it offers a variety of features including filters, measured names, in-memory data, actions, complex visualizations, maps, strong security, trend lines, and more.
Action filters are used to enhance the interactivity and informational content of your dashboards by adding more information to their visuals.
What is Dashboard in Tableau?
Tableau Desktop is used to analyze data from several sources to build a dashboard, which consists of various representations.
It is used to simultaneously monitor and compare a number of data variables.
The workbook tabs at the bottom of the Tableau Desktop interface contain dashboards. Every time a new dataset of the file is added, the visuals on the dashboard are updated.
You may also add filters, actions, and other features to this view to customize it to your needs. Among them, tableau dashboard actions provide your dashboards with an interactive component.
Let’s study more about them in depth and then discover how to use Tableau to develop dashboard actions.
Why are “Actions” required in Tableau Dashboards?
A basic Excel worksheet, a database like SQL Server, or a big dataset like an Amazon warehouse may all be made more intelligible by turning them into graphs, figures, and other visualizations.
These dashboards now have an interactive component thanks to actions in the tableau, which also allow users to create their own unique dashboards.
What are Action Filters in Tableau?
In Tableau, actions are the customizable components that can be added to reports and dashboards that are powered by worksheet data.
This makes it possible for the user to manipulate several facets of the data analysis and engage directly with the visuals.
The applied action to that visualization modifies the values in a set and produces a customized view when you choose a mark on the set visualization. In Tableau, there are primarily three kinds of actions :
Tableau Filter Actions : used to filter different charts and use the drill-down method in Tableau.
Tableau Highlight Actions : The user may choose a Tableau Highlight Action and evaluate its placement in different charts. Simply said, emphasized acts drown out the noise and concentrate on the important principles.
Tableau URL Actions : Connects your visualization to a web page, program, journal, or other tableau server dashboard.
Steps to implement Tableau’s Actions
If you’ve previously made a dashboard, creating actions in Tableau doesn’t take much work.
If not, you won’t be able to use Tableau to accomplish all three types of actions without at least two or three visuals. Take any dataset that you have already.
To build two straightforward visualizations in Tableau, complete the following steps :
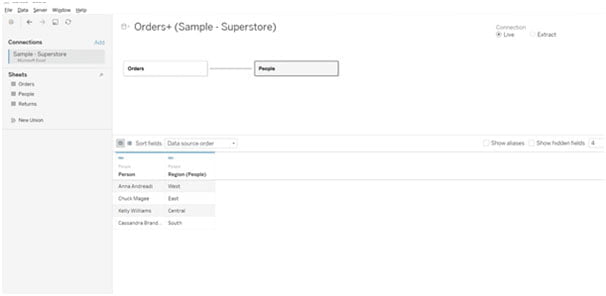
Step 1 : Launch Tableau Desktop and choose the ‘Connect to Data’ option from the data panel on the interface’s left side.
Step 2 : Access the spreadsheet, load the sample dataset and connect the tables (sheet1).
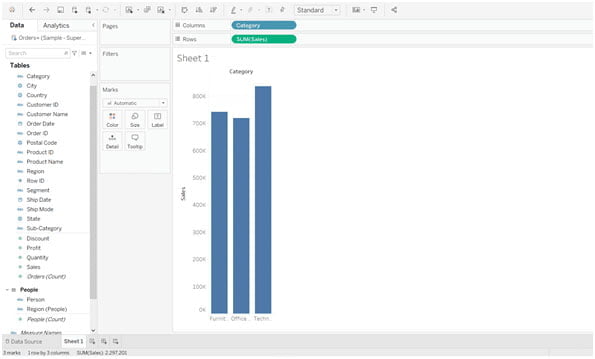
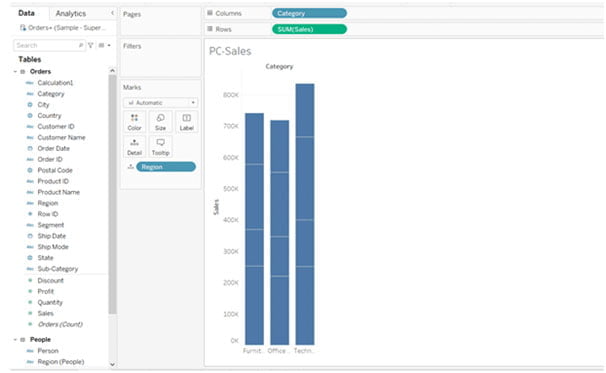
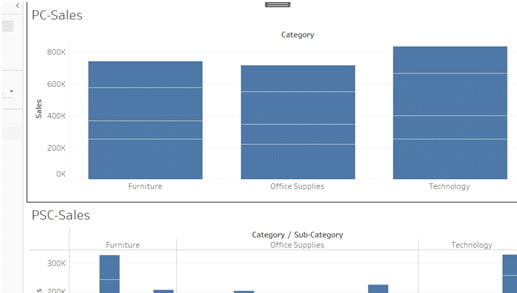
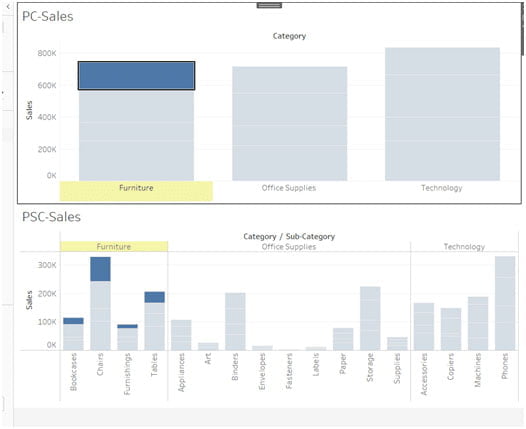
Step 3 : Hover over the sheets in the bottom-left corner of the interface once the data has loaded, then add a new sheet for the Product Category Sales (PC-sales).
Step 4 : Drag and drop the Category and Sales variables into the appropriate rows and columns beneath the toolbar by doing so in the tables section.
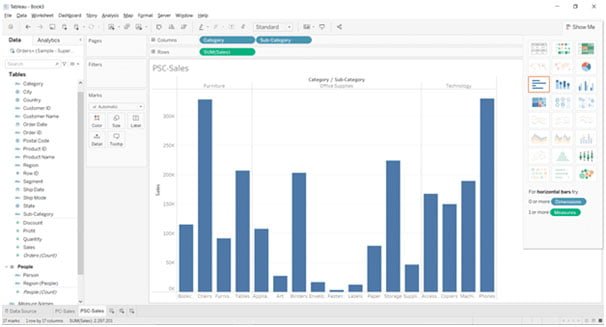
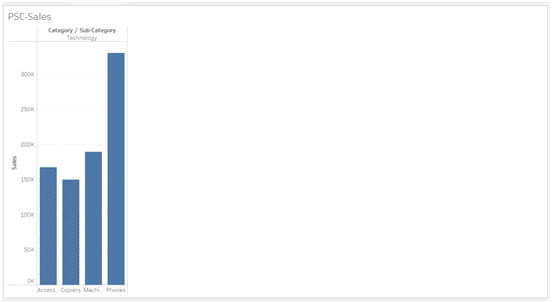
Step 5 : Add a new sheet for the Product-Sub-Category Sales after that (PSC-sales).
Step 6 : Subcategory, Sales, and the Category variable should all be deleted from the column section.
Step 7 : To implement the tableau dashboard URL actions, we’ll similarly provide more visuals, such as maps.
Step 8 : Now you have two options: either go to the following step and build an action button in Tableau, or modify the layout of the visuals and add labels.
Filter Actions in Tableau
Events in one sheet are sparked by the filter actions, and the outcomes are displayed in the other. Therefore, these are the steps to creating a tableau filter action :
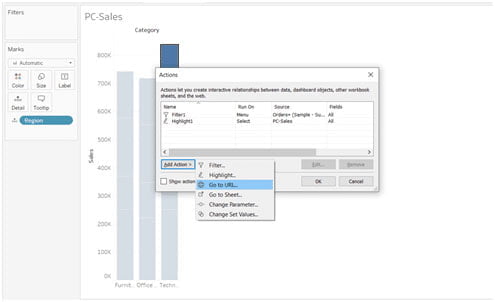
Step 1 : Select Filter from the Add actions menu under Worksheet>> Actions.
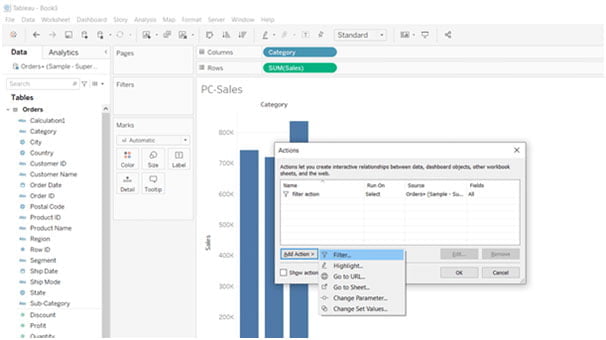
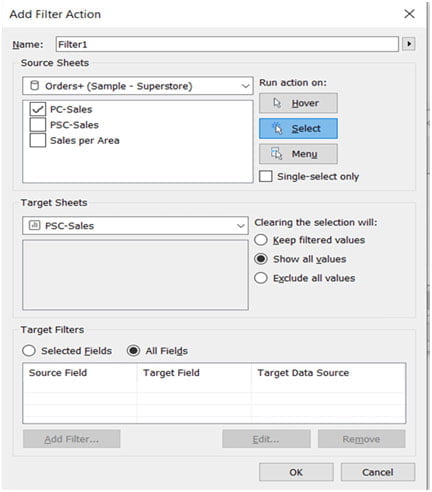
Step 2 : The “Add Filter Action” dialog box will display once you click “OK.” From here, you can choose the trigger on which you want to conduct your action as well as the sources and target sheets.
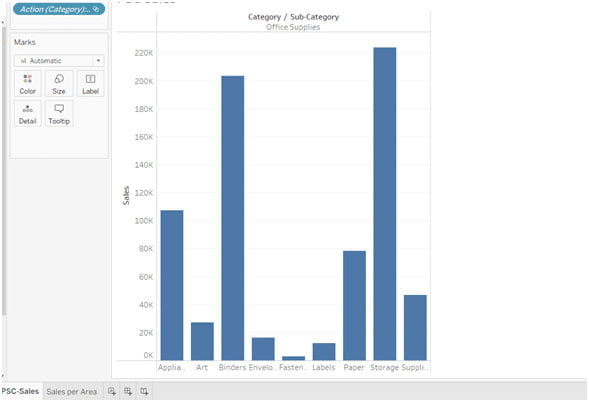
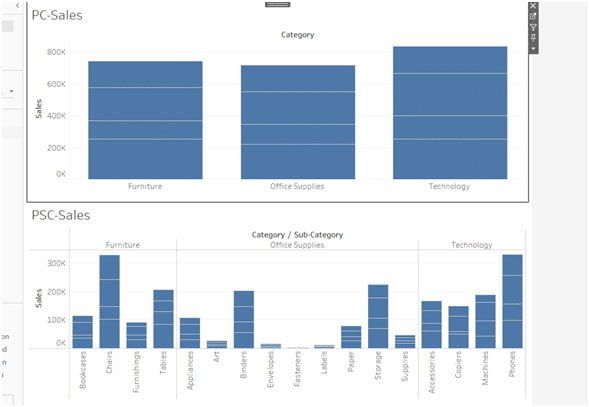
Step 3 : Apply the modifications and pick a category on sheet 1 from the list (PC-Sales).
Step 4 : The action will change to the goal sheet (PSC-Sales) and highlight the appropriate sub-category as soon as you click on the category.
Step 5 : In the PC-Sales figure, for instance, I chose the Office Supplies category, which caused the action to go to PSC-Sales and highlight the appropriate subcategory.
Step 6 : Additionally, you can select the values that will be displayed by the action as well as the method of initiating it (either by hovering or by displaying a menu).
Step 7 : For instance, you may alter how your action functions and proceed directly to the target visualization by changing the “Run action” from Select to Menu.
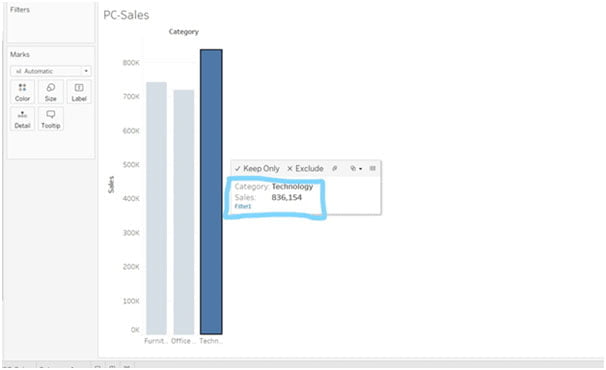
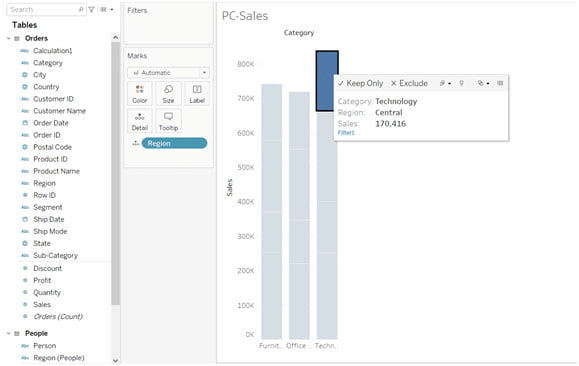
Step 8 : The action will now hop onto the target figure and display the associated data if you click on the filter1 marked in the box.
Highlight Actions in Tableau
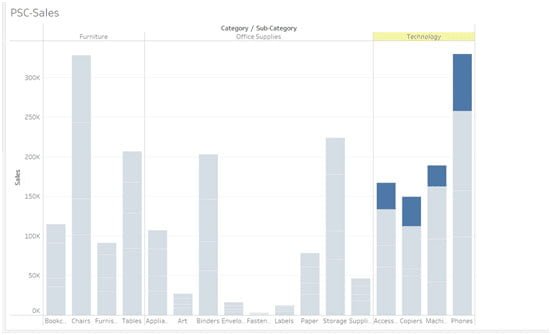
You need to provide a second variable called Region to emphasize the action tableau.
This will produce a stacked bar chart with each bar of the category divided according to the regions.
If you did this for both visualizations, the outcome would resemble this:
A tableau highlight may be created in a manner that is quite similar to filter actions.
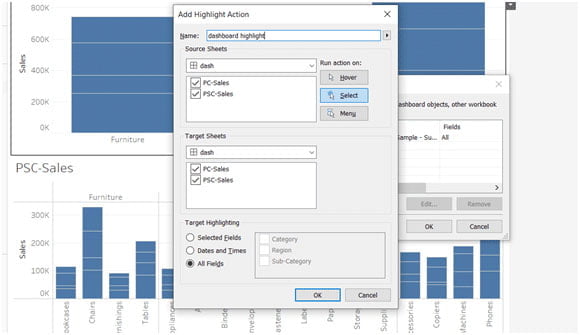
Step 1 : Here, all you have to do is choose Highlight from the add actions menu instead of Filter.
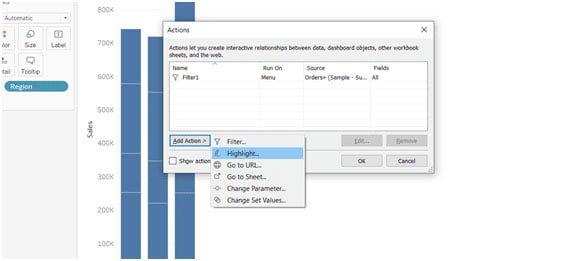
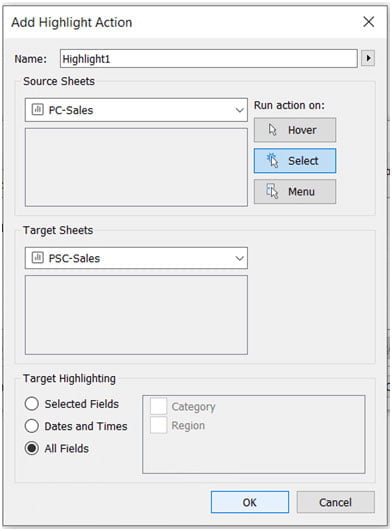
Step 2 : Select the source and target worksheets from the highlight action box at this point, and then click the OK button to apply the changes.
Step 3 : If you click on any portion of the stacking bar after the adjustments have been made, all the data, including the region and sales, will be displayed.
Step 4 : When you drag your cursor over the target worksheet, you will see that the corresponding category has been highlighted.
Additionally, you can add this action to the dashboards and alter the visualizations using the button filter tableau.
We’ve made a straightforward dashboard with visuals as an example. But if you wish, you may include more of them.
To add filters to the Tableau dashboard, proceed as follows:
- Use the add actions feature to create a new Highlight by going to the Dashboard>> Actions.
- Apply the necessary adjustments by clicking the OK button after making them.
- All the visualizations connected to the field or bar you’ve chosen will now be highlighted by the action.
URL Actions in Tableau
The procedures for making a Tableau URL Filter and using it on the visuals are as follows:
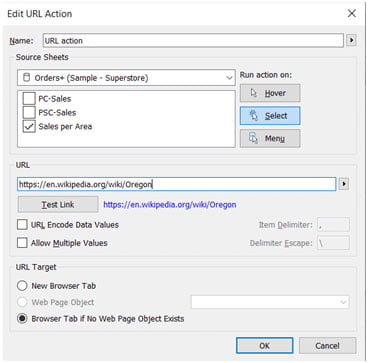
Step 1 : Click OK after navigating to the Worksheet>> Actions>> Add actions>> URL.
Step 2 : On the UI, a dialog box with the title “Add URL action” will show up.
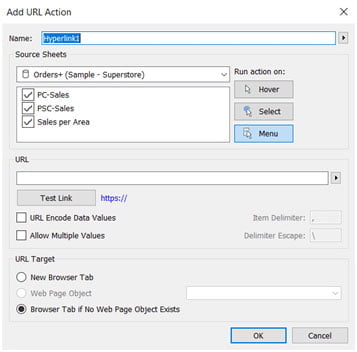
Step 3 : The URL action may be renamed here, the source sheet can be chosen, and the URL of the resultant webpage you wish to open can be added. For example, we’ve included the state’s Wikipedia link.
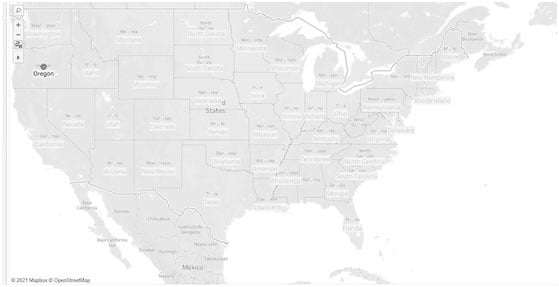
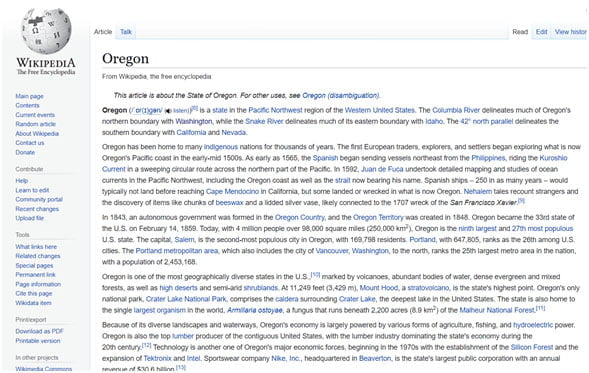
Step 4 : When you click on the state, the action will open the URL in your browser. For each State you click on, the action will open the same links.
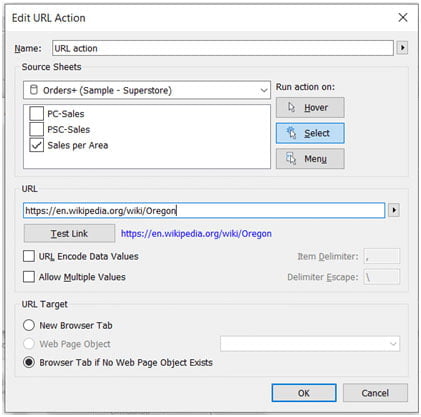
Step 4 : Open the URL action dialog box and delete the state name from the URL to make the URL open the precise page of the state you clicked on.
Step 5 : Now choose the State variable from the drop-down box by clicking on the mark next to the URL that was just specified.
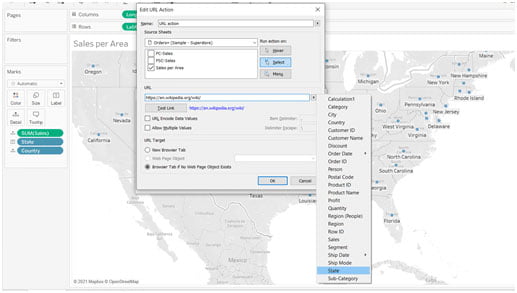
Step 6 : This will produce a tableau hyperlink whose URL will continuously change depending on whatever State you select.
Steps to add Tableau Actions in Dashboard
Additionally, actions may be added to dashboards, and visualizations can use the button filter tableau. We’ve made a straightforward dashboard with visuals as an example. But if you wish, you may include more of them.
To add filters to the Tableau dashboard, proceed as follows:
Step 1 : Use the add actions feature to create a new Highlight by going to the Dashboard>> Actions. Any action is acceptable; the procedure is essentially the same.
Step 2 : Apply the necessary adjustments by clicking the OK button after making them.
Step 3 : All the visualizations connected to the field or bar you’ve chosen will now be highlighted by the action.
Conclusion
As they display extra information using the same visualizations, Tableau actions are a really helpful tool.
Depending on the objectives you wish to accomplish, you can also apply a single operation to several sources and targets.
Even on Tableau dashboards, you may use similar button filters to solely highlight the desired data. Shape up your career in our Tableau Training Institute in Chennai.