
Opens in a new tab
Software Training Institute in Chennai with 100% Placements – SLA Institute

Data Analytics Training In Chennai

4.70
(4856)
DURATION
Real-Time Location Services
2 Months
EMI
0% Interest
Mode
Rank-Based Percentile Gui Calculator using Tkinter
Live Online / Offline

Upgrade your career with the Data Analytics Training in Chennai at Softlogic Systems. Our Data Analytics Syllabus covers the data analytics fundamentals, statistical analysis, data visualization, SQL, Excel, Python for analytics, and business intelligence tools. Our Data Analytics course in Chennai comes with placement support, flexible schedules, real-time projects, and certification to help you successfully launch your career. Our placement team connects you with top IT companies for a smooth career transition.
Enroll Now
Download Syllabus
0%

AI Powered Syllabus

0+

Realtime Projects

0+

Students Placed in Sept

0+

Certificates

Check Your Eligibilty for IT Training

Ready to start your tech career? Whether you have recently graduated and want to begin your IT career, or want to upskill for your next phase, our Eligibility Assessment Form makes the process easy to begin. For this Data Analytics Course In Chennai Developer Course, we will match your skills and goals to the best training structure for you. Just fill in the form below for an easy start on your course. Take your first step today!
What We'll Need From You?
Personal & Contact Details
Name and phone number for direct interview updates
Academic Background
Age category, educational qualification, and graduation year.
Technical Experience
Prior programming knowledge and relevant IT certification details.
KNOW MORE ABOUT COURSE +91 86818 84318

IT Training ELIGIBILITY TEST

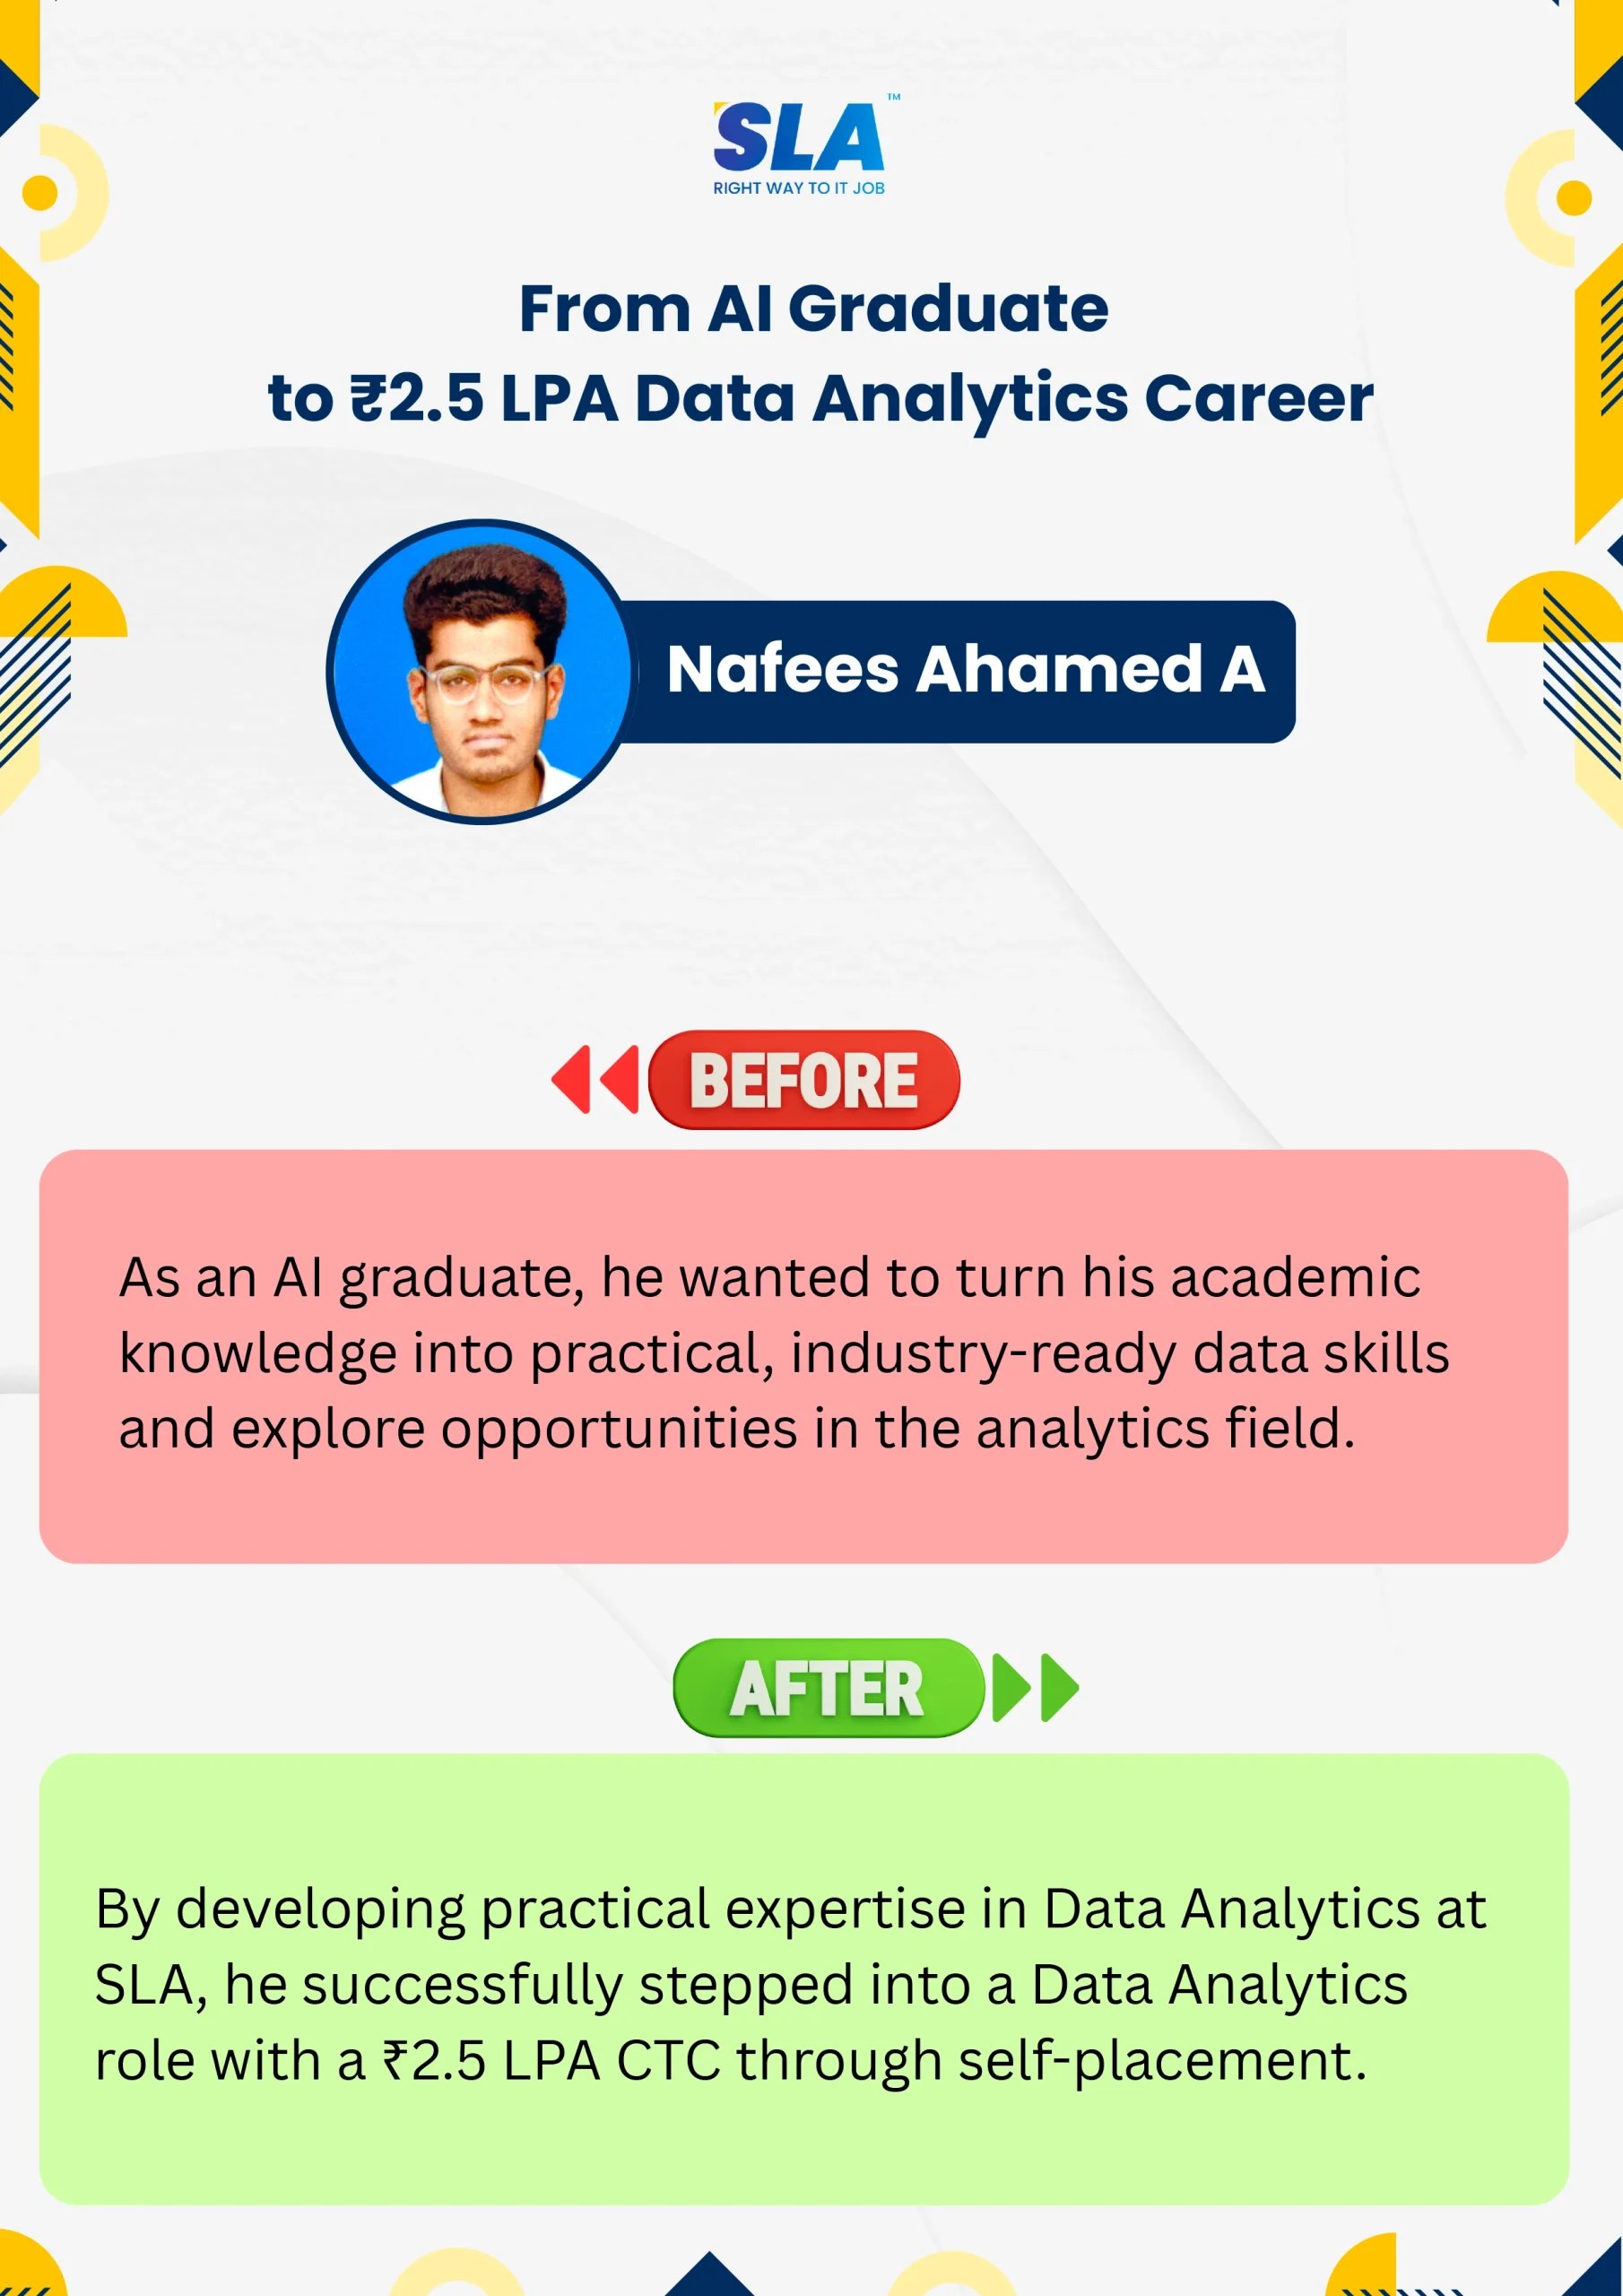
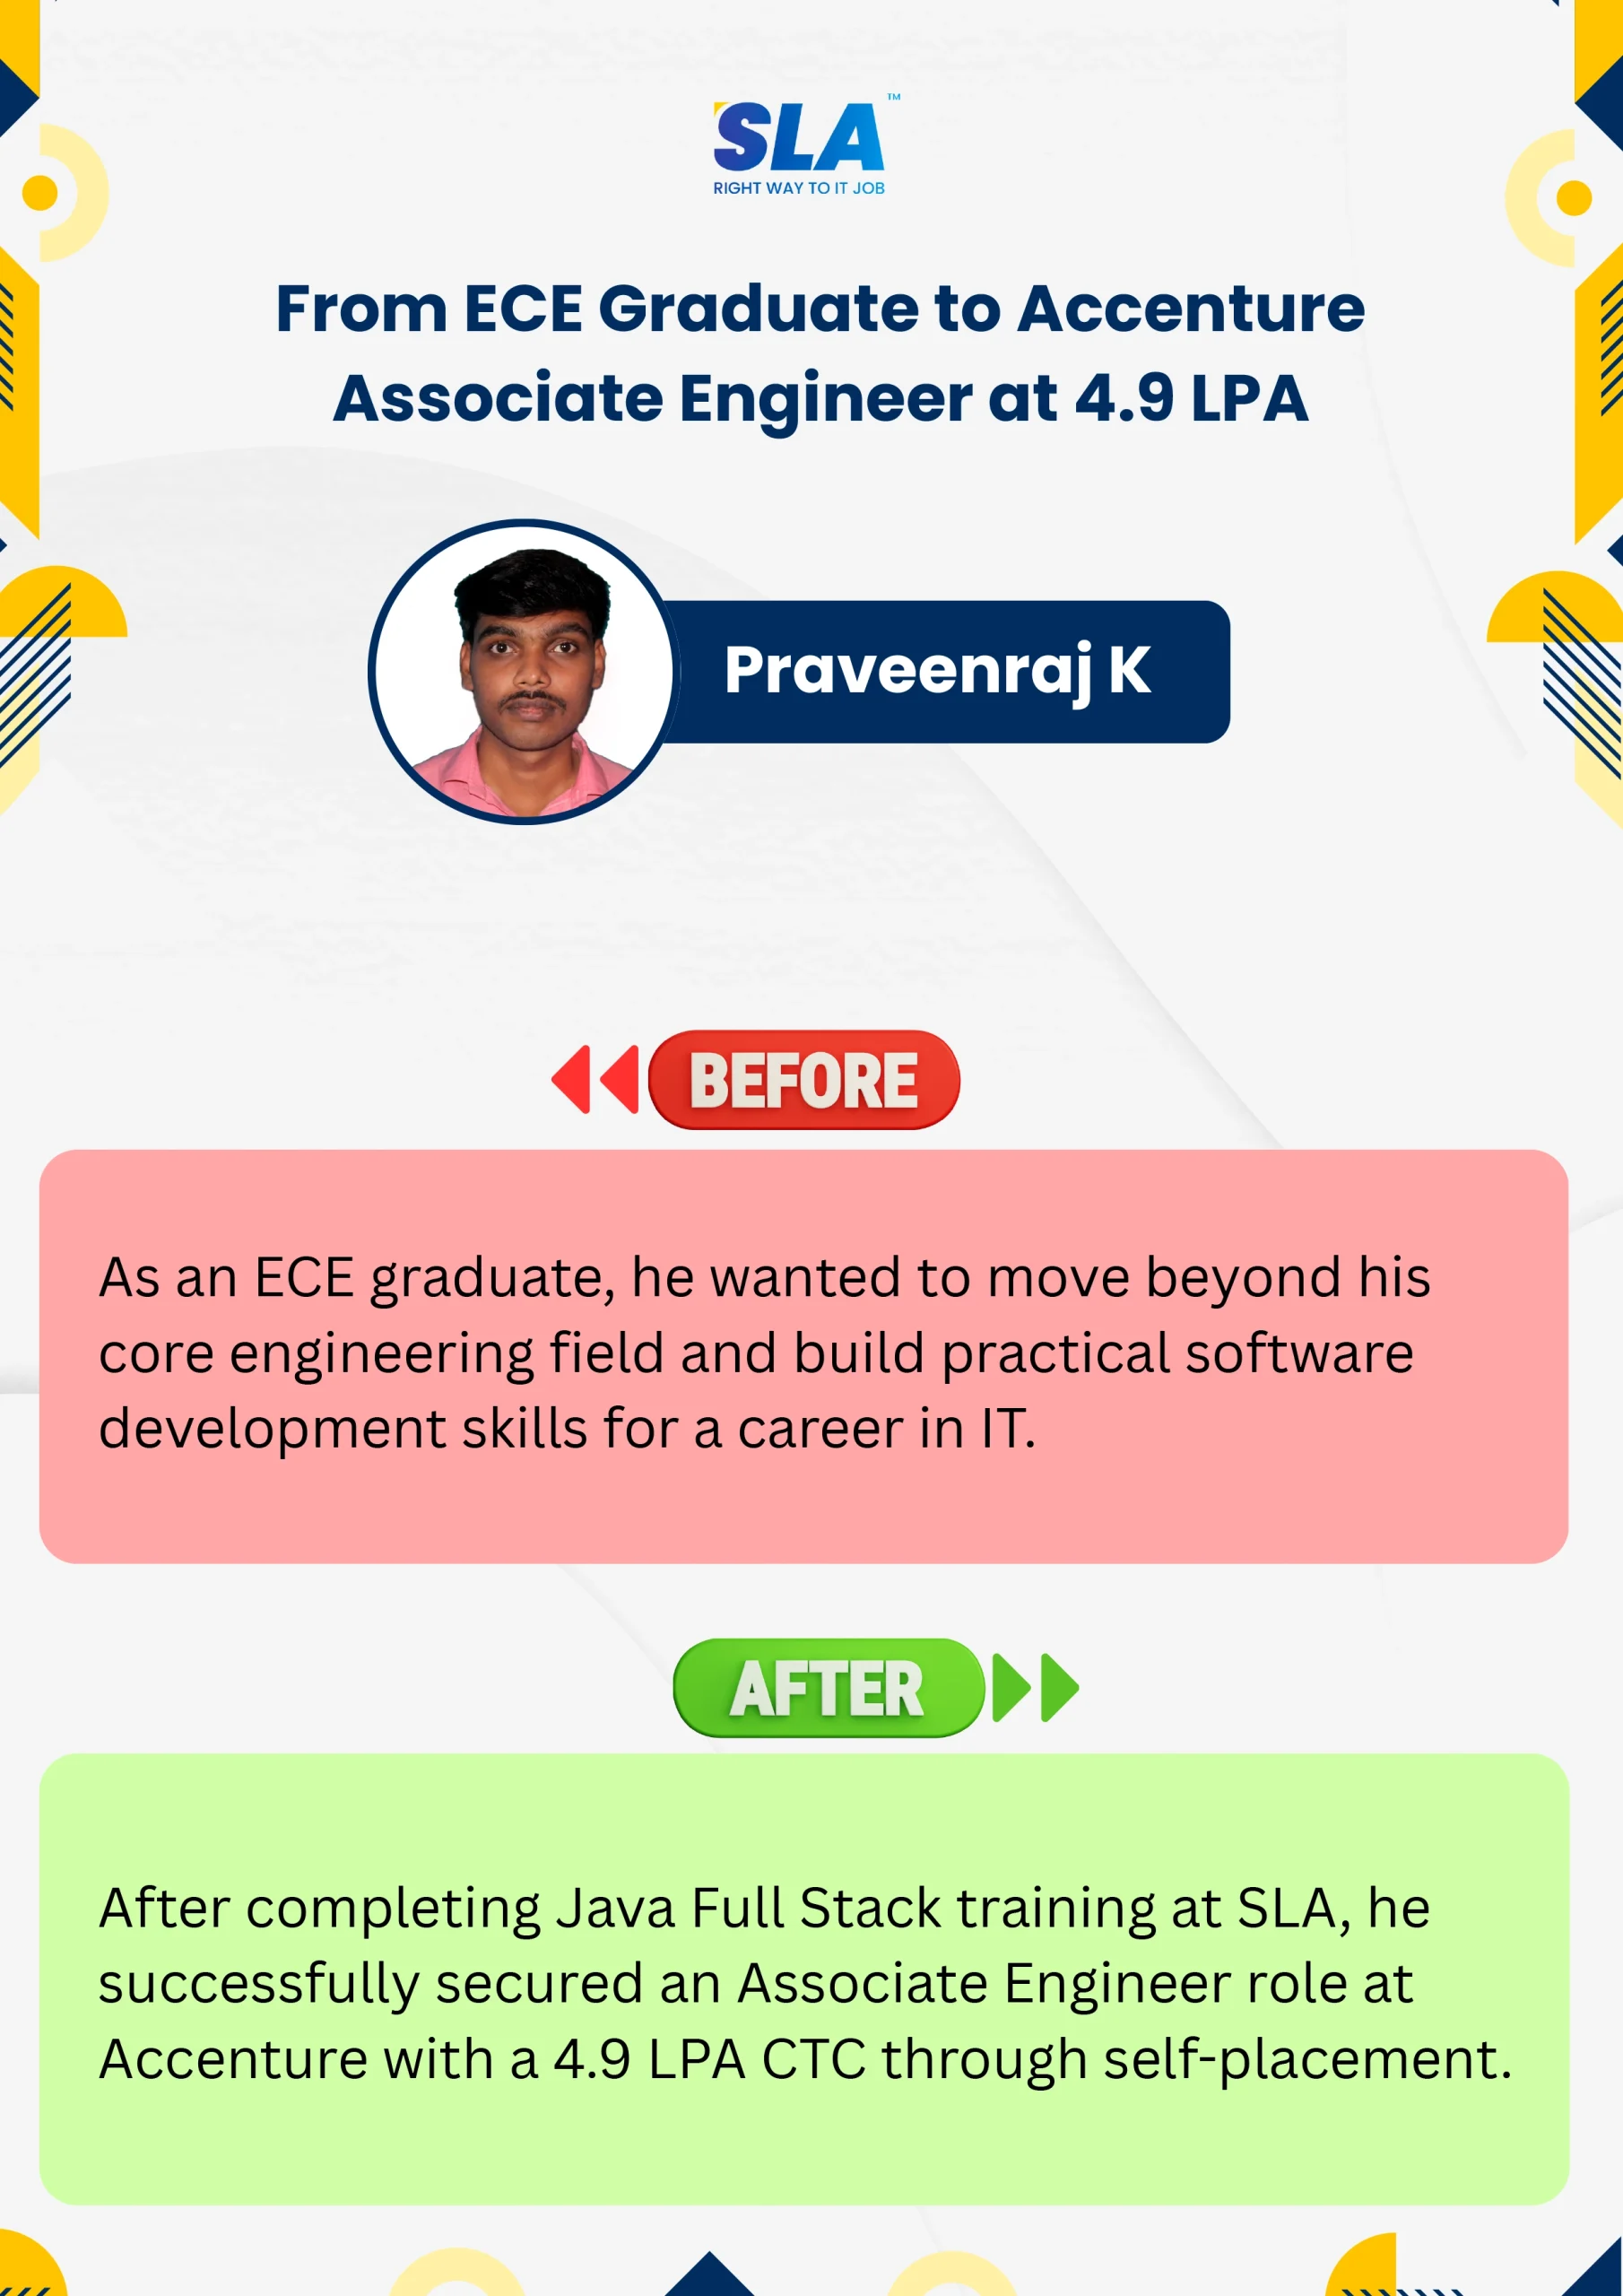
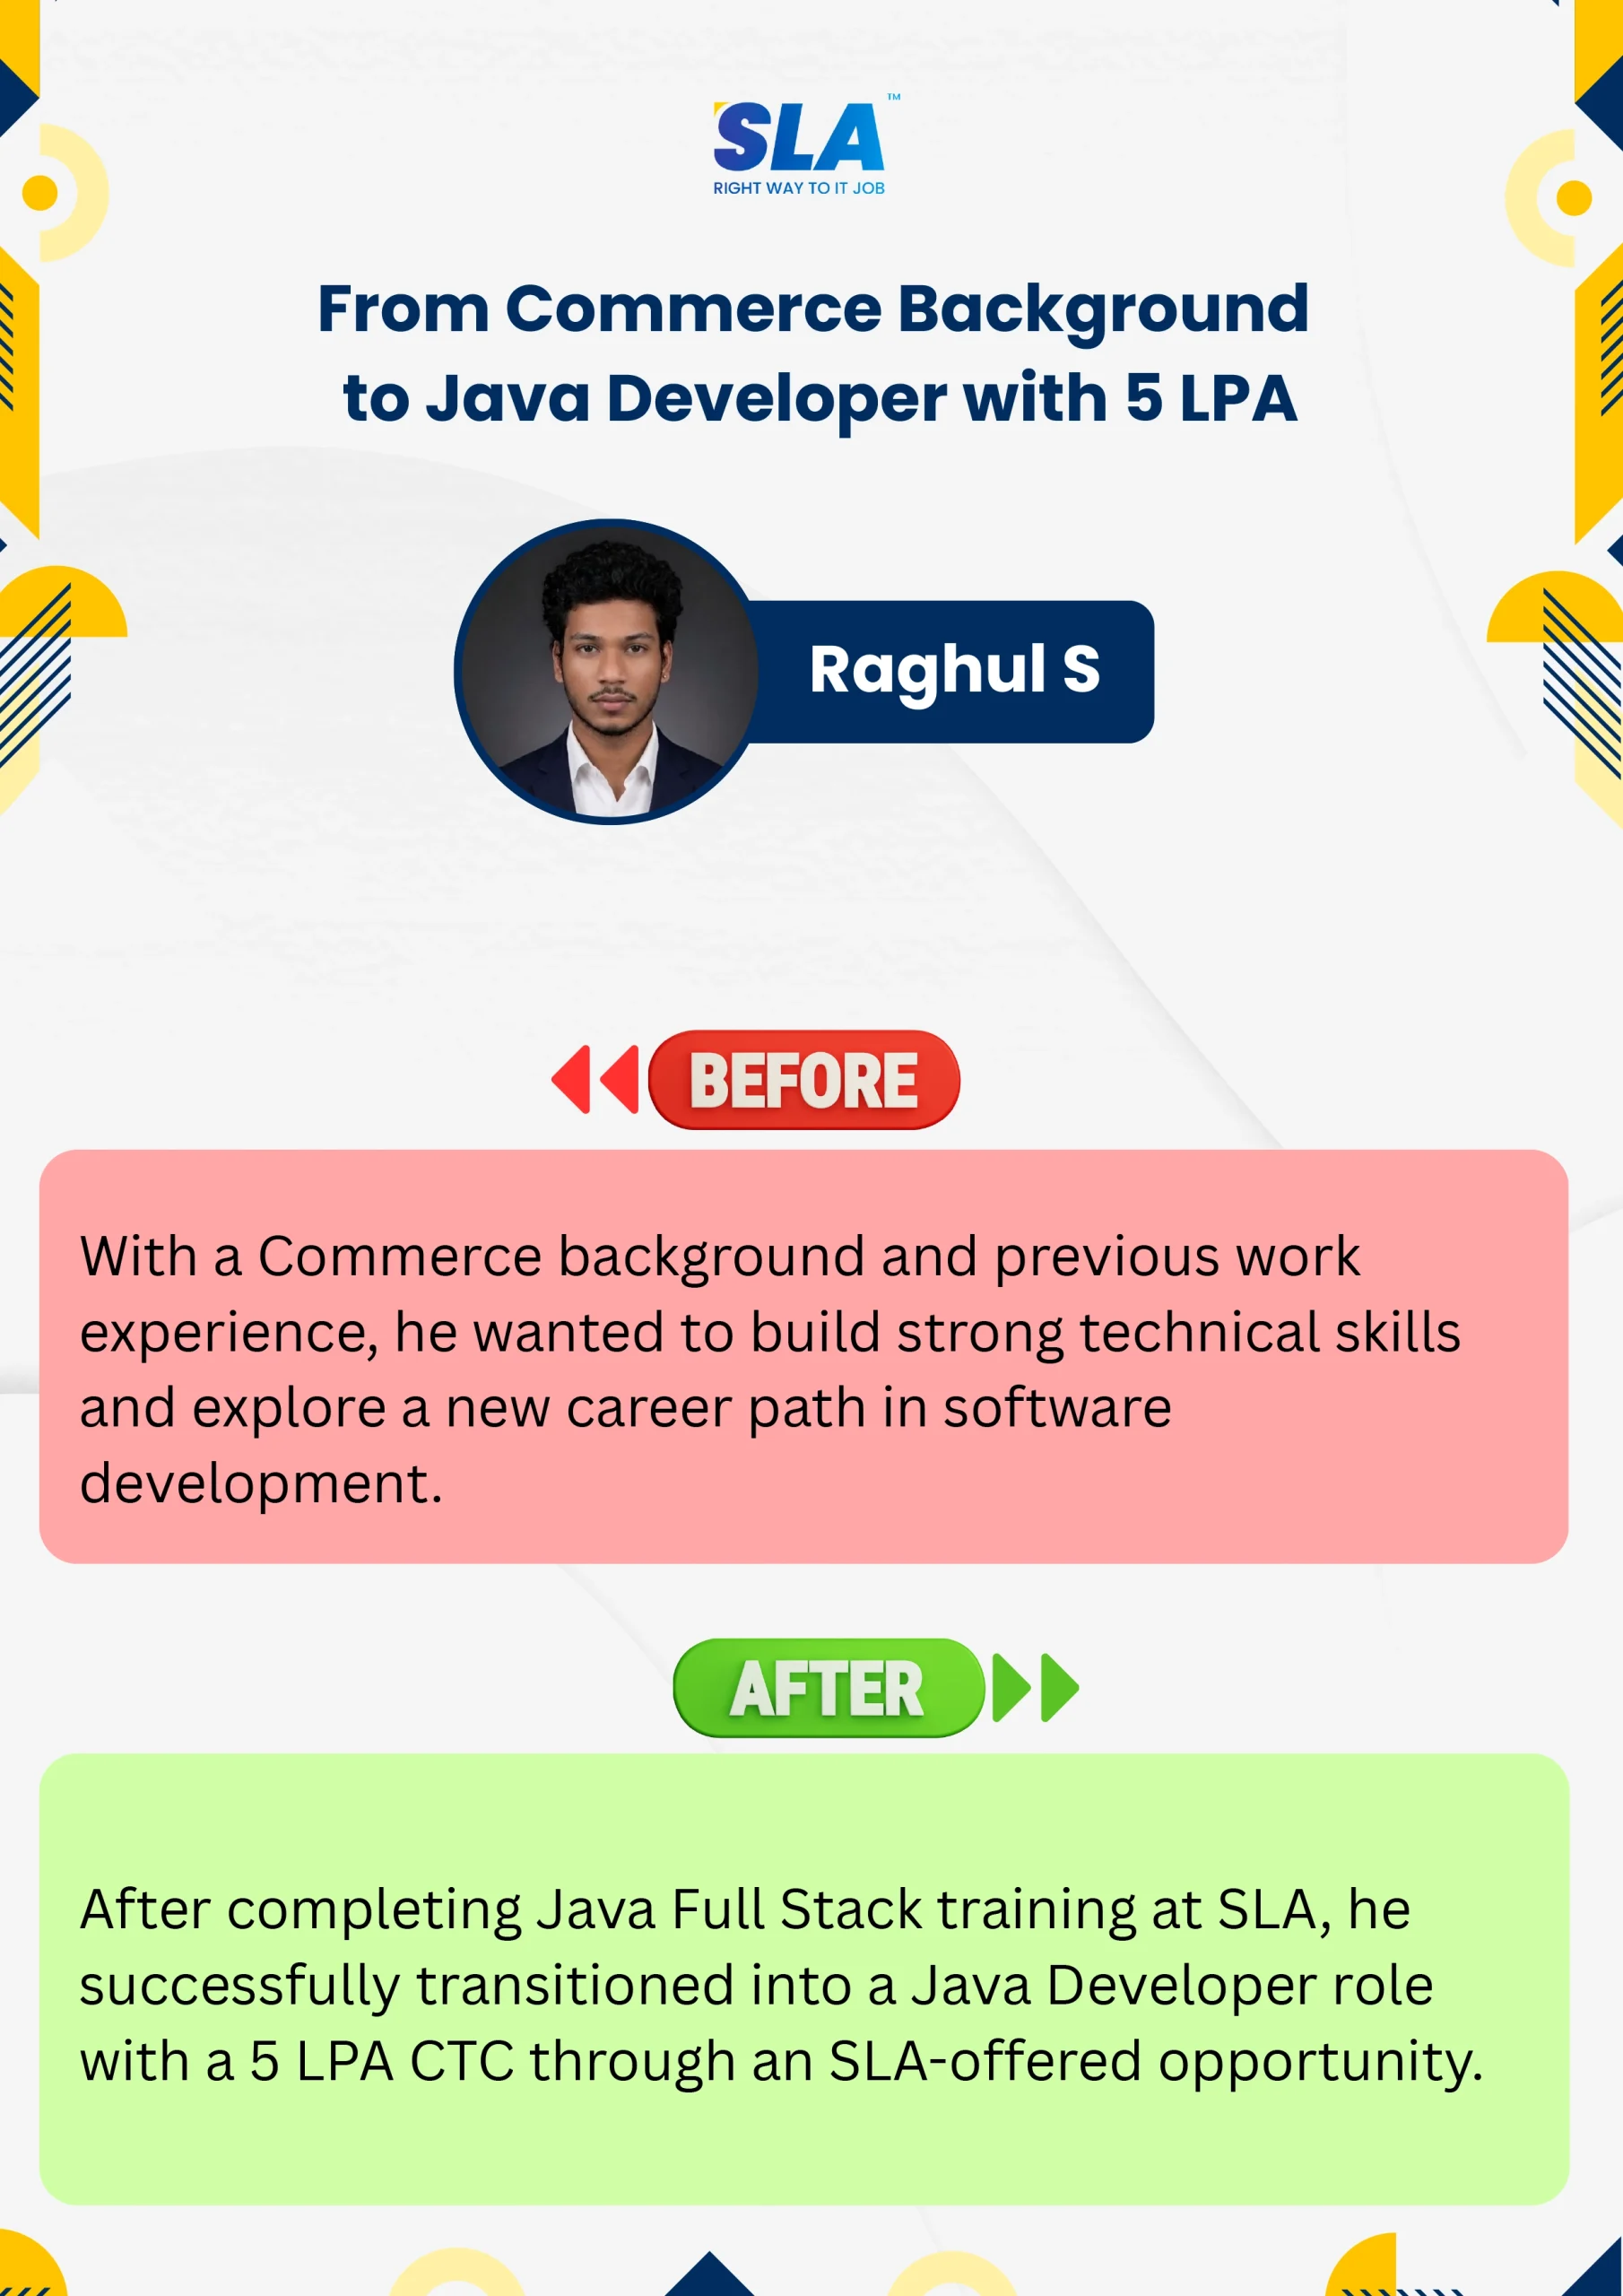
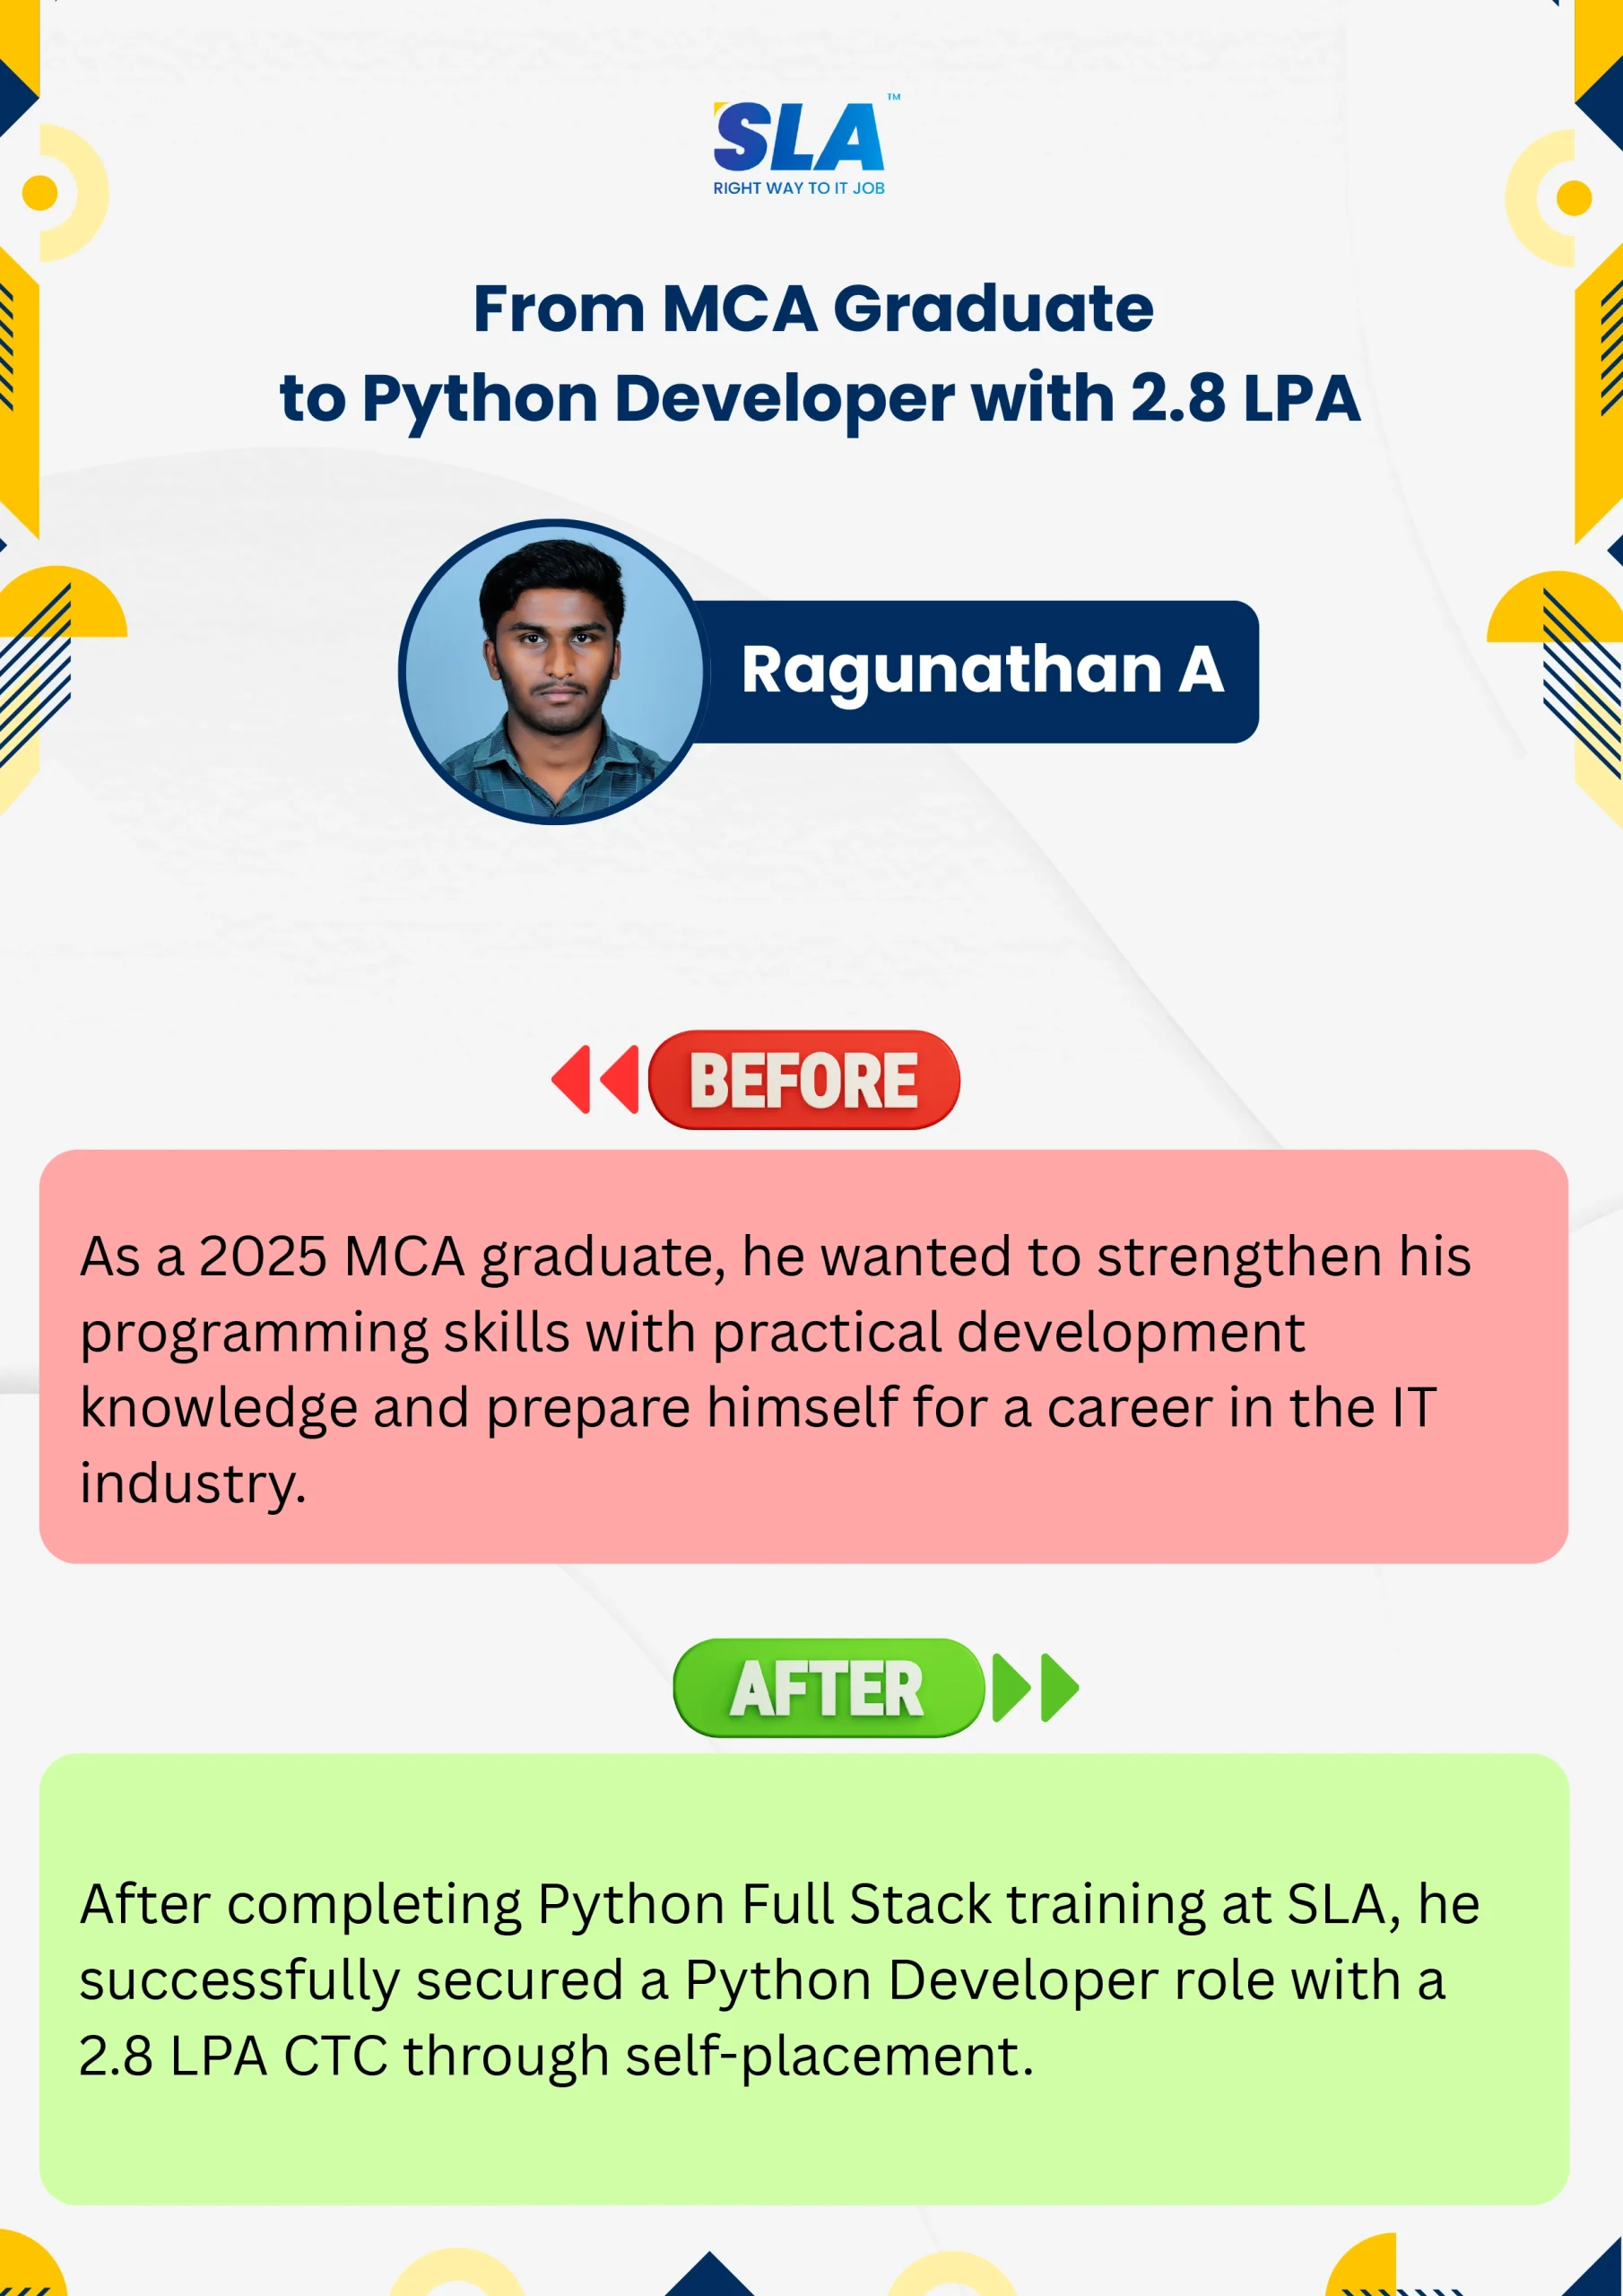
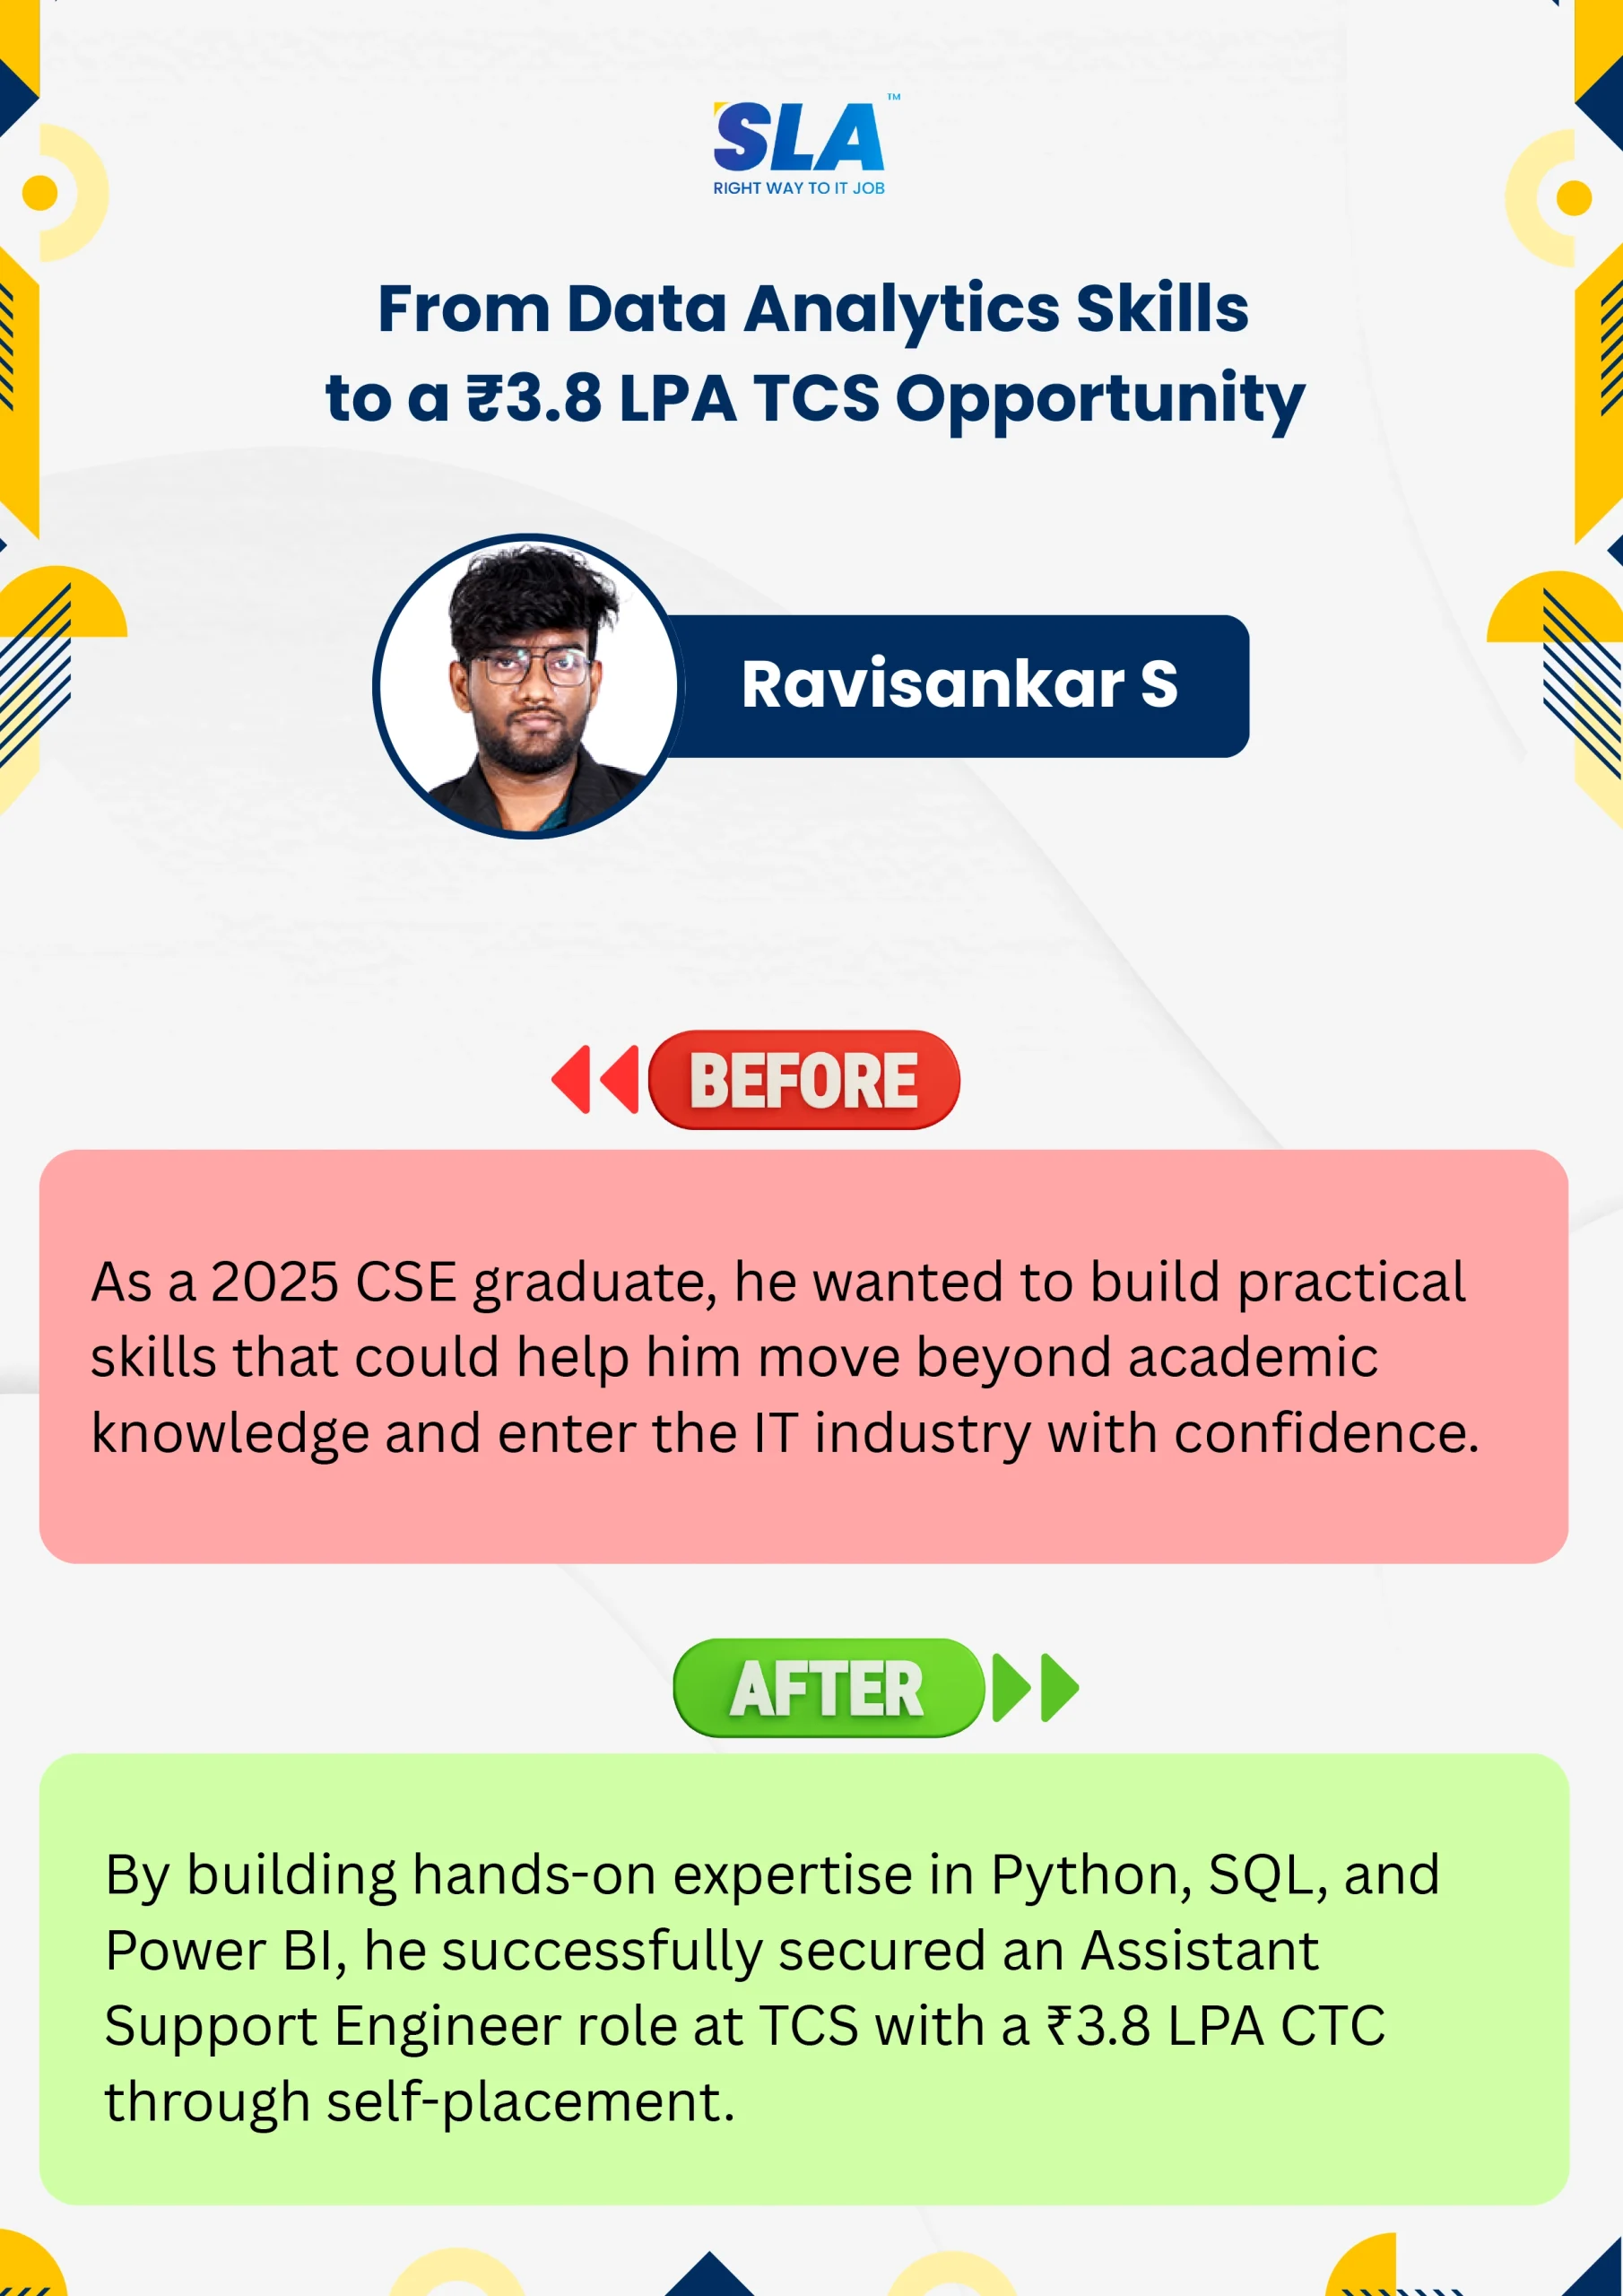
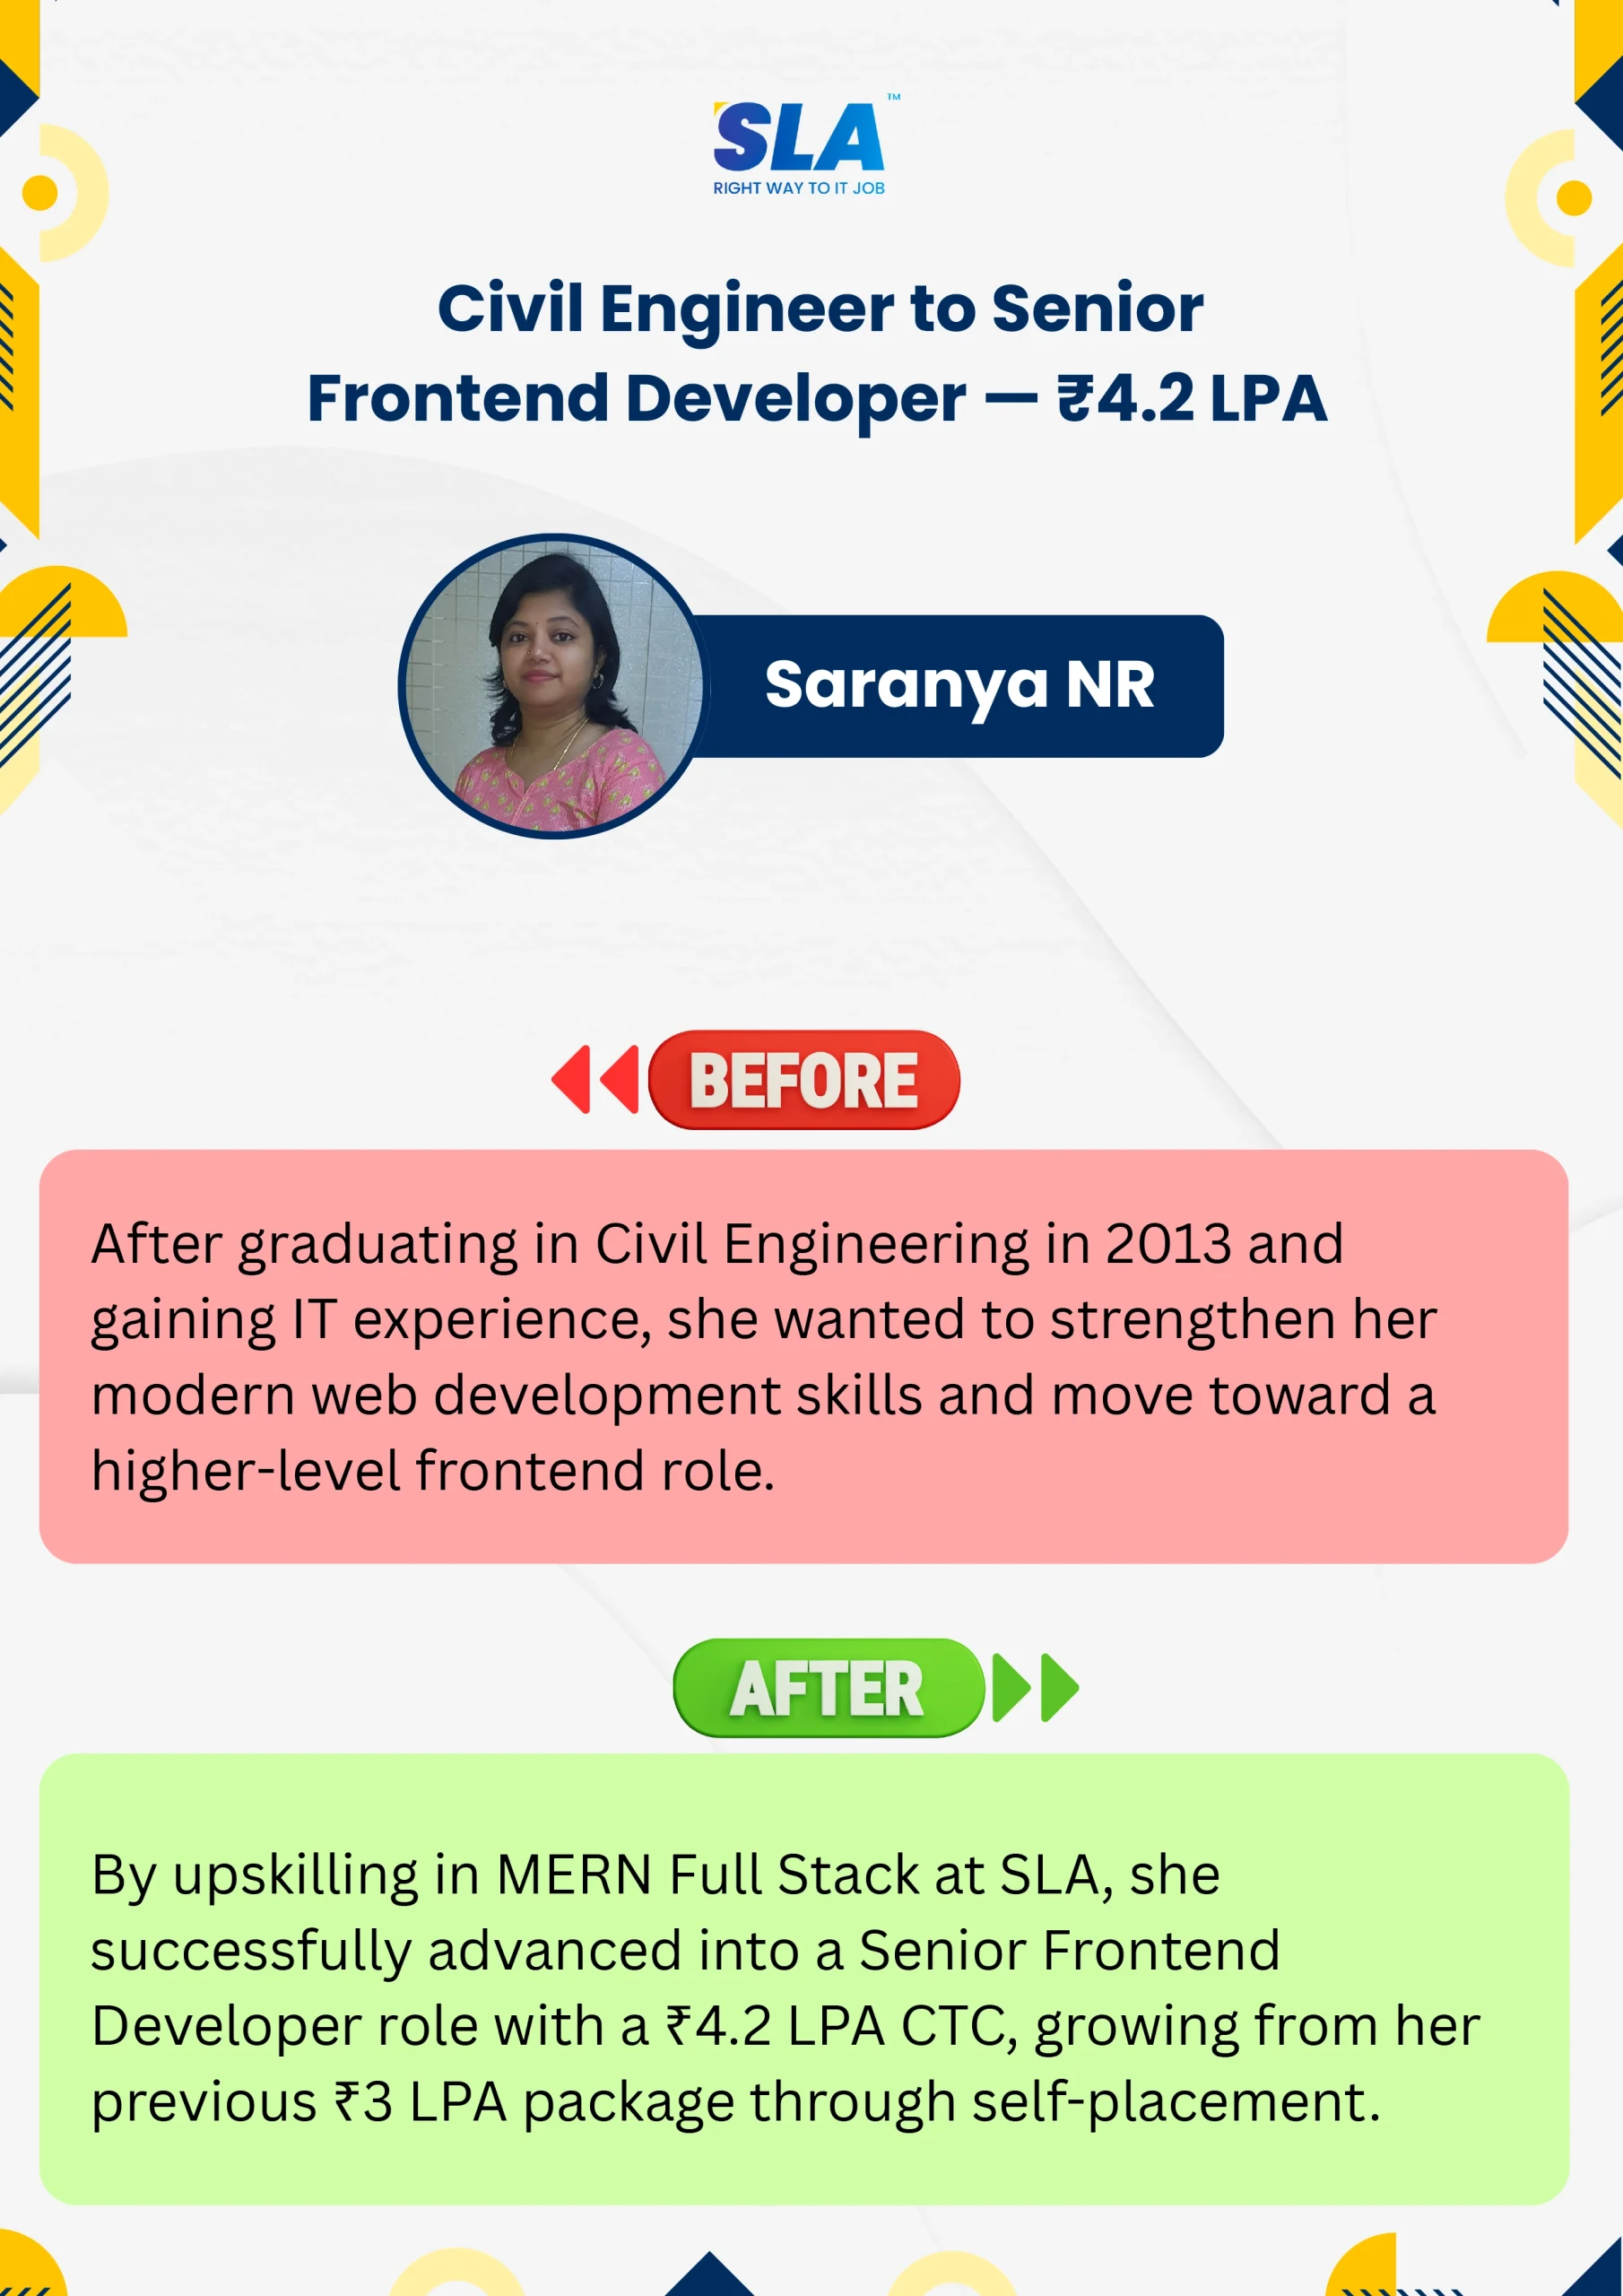
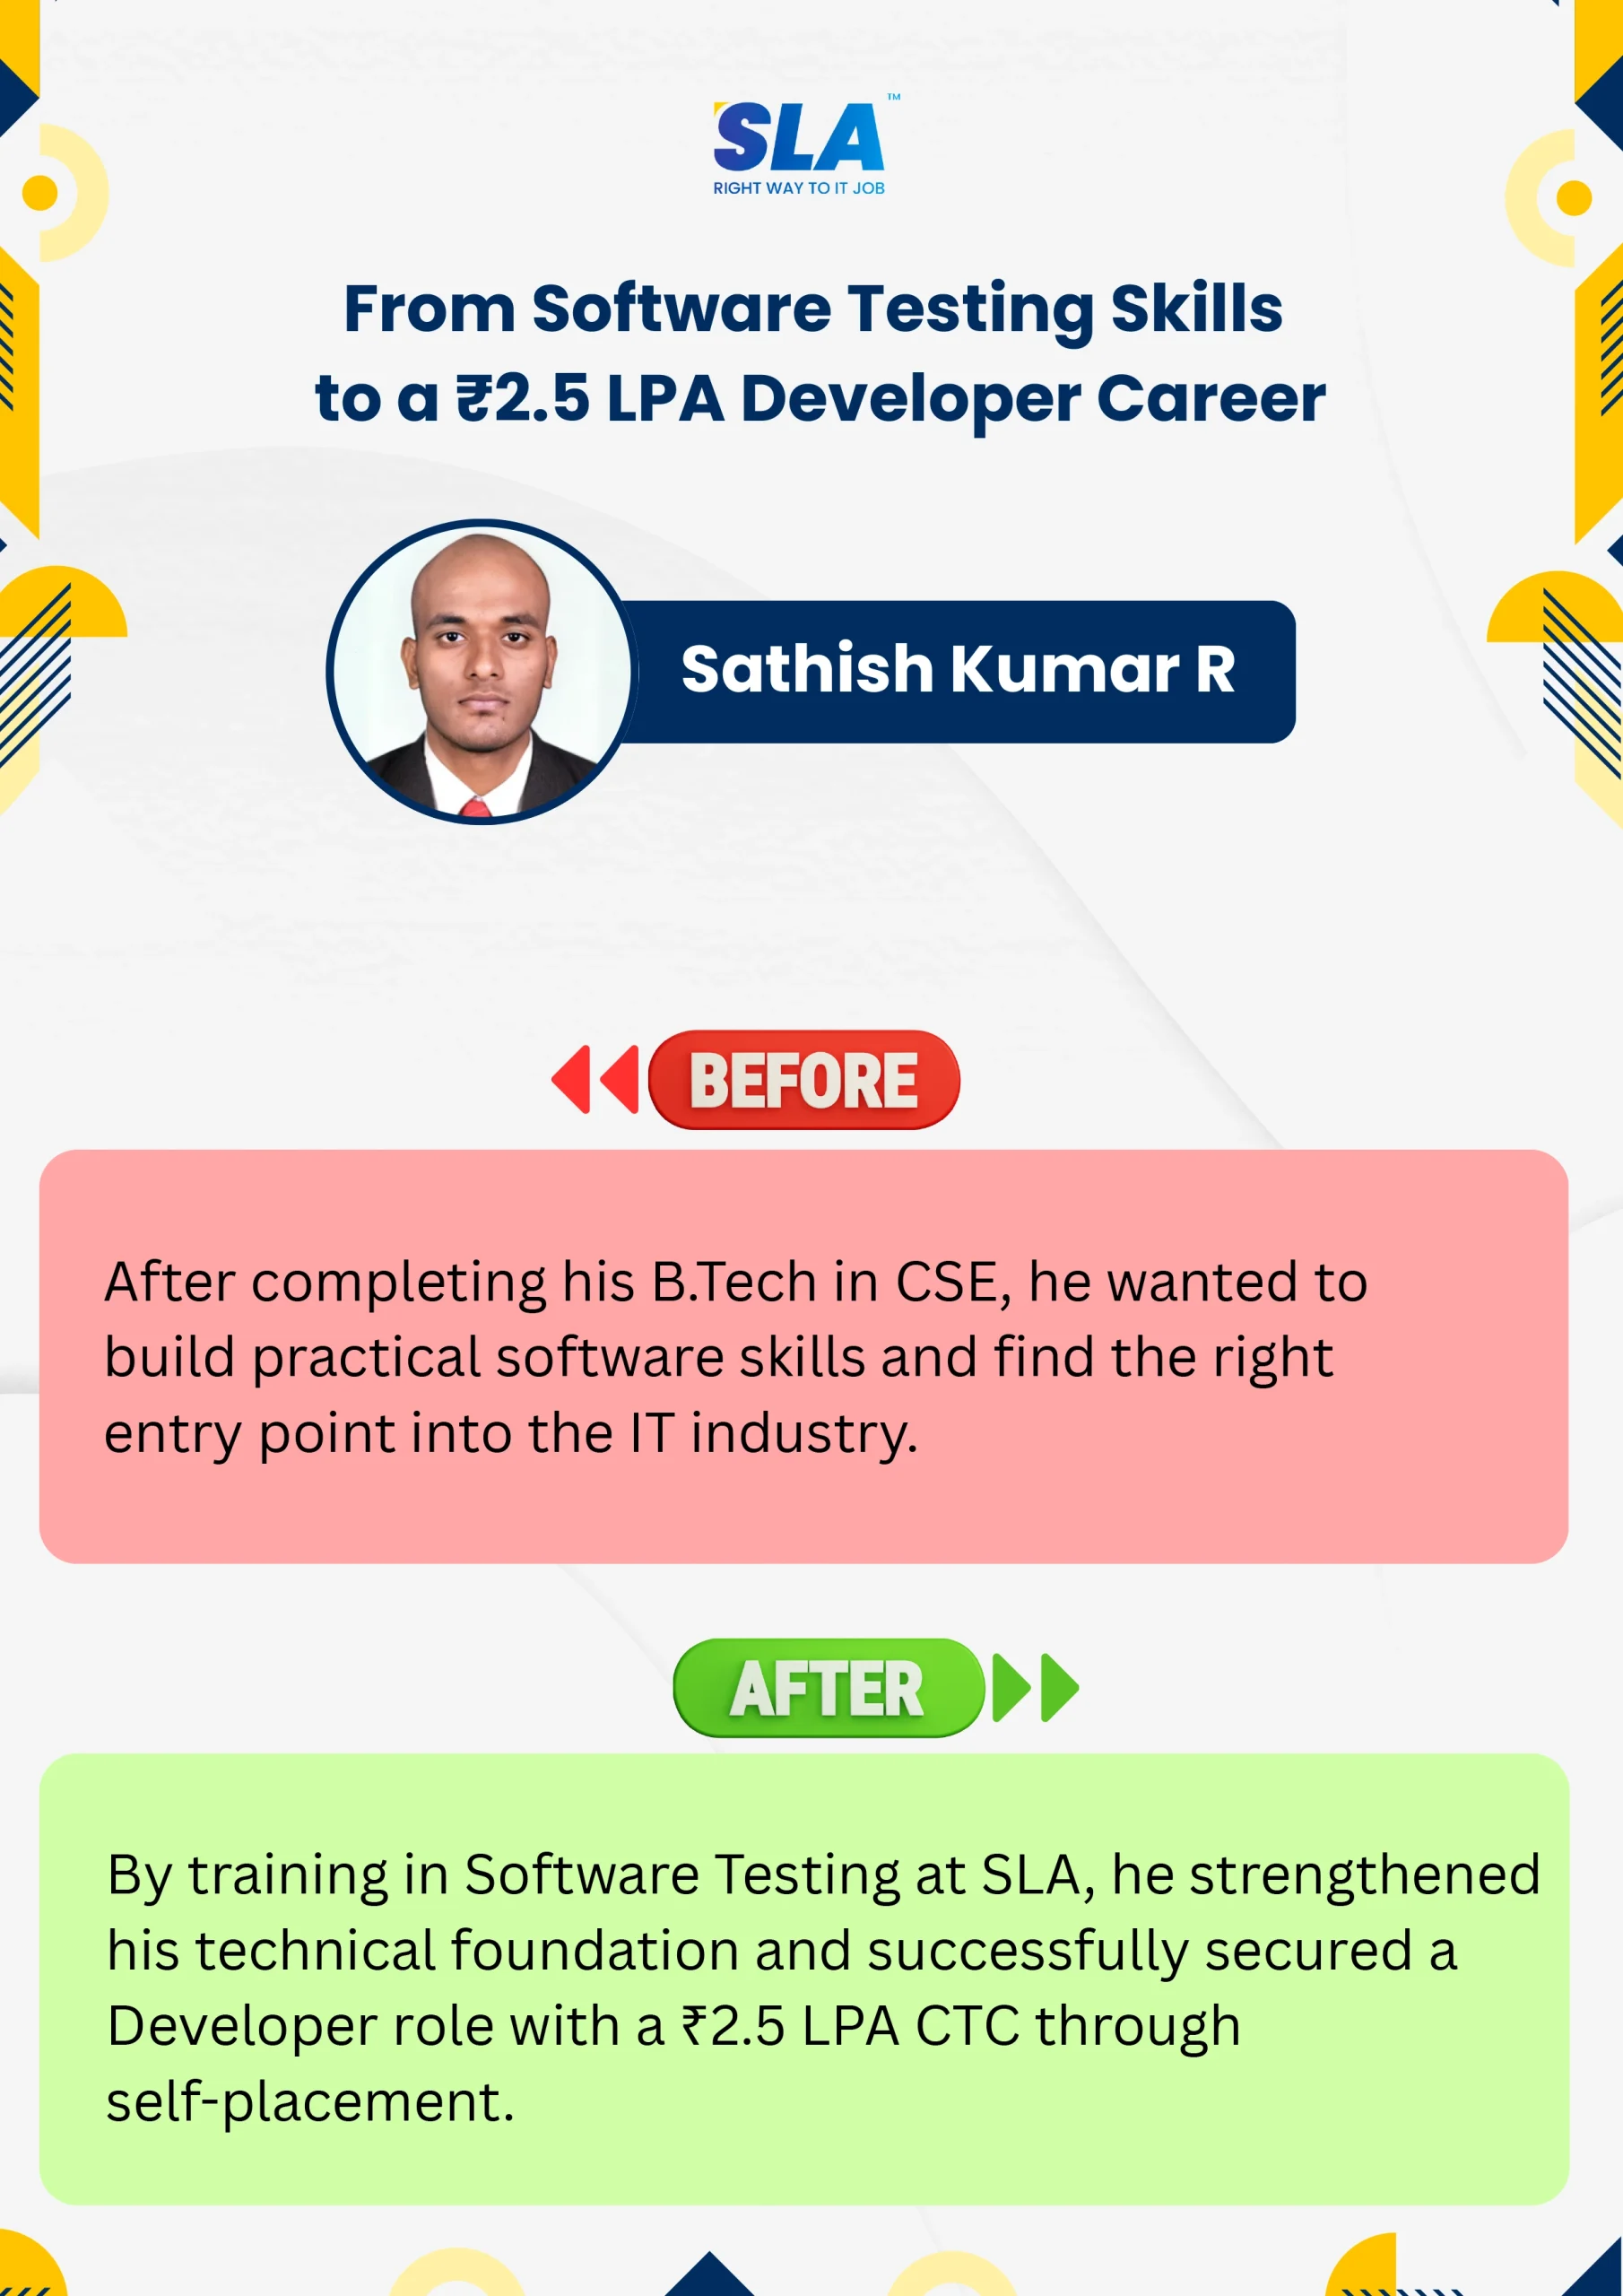
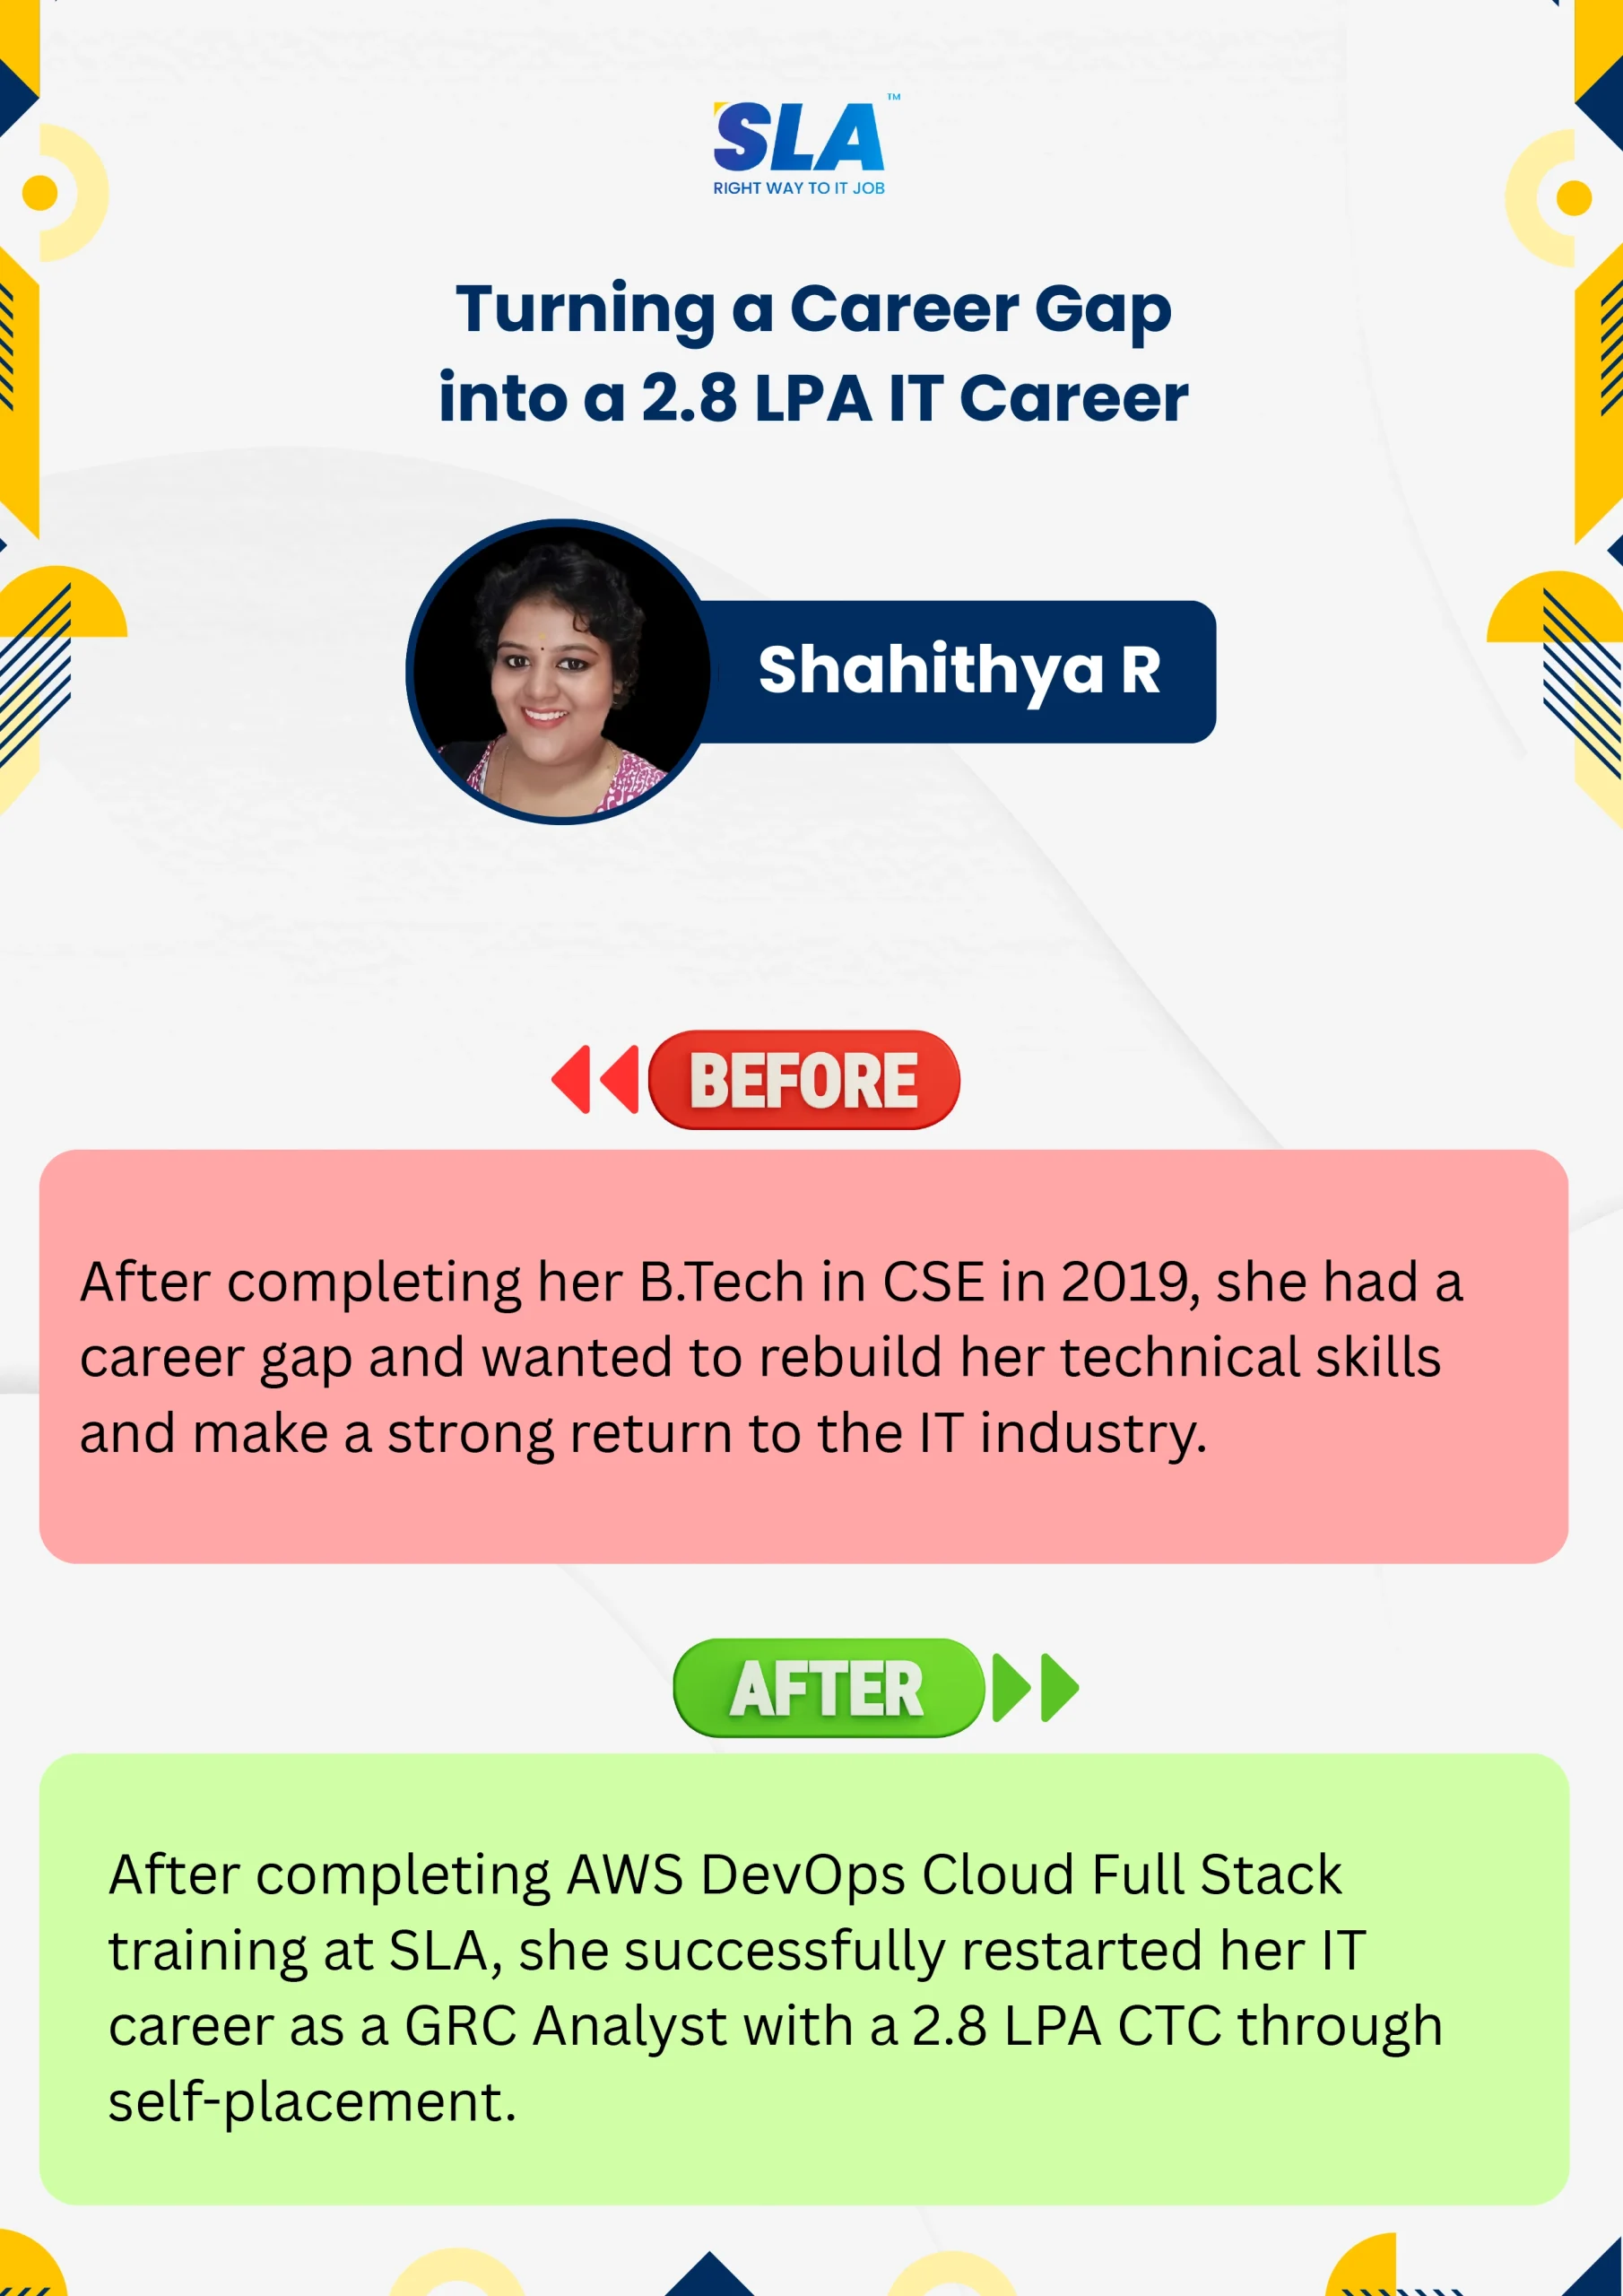
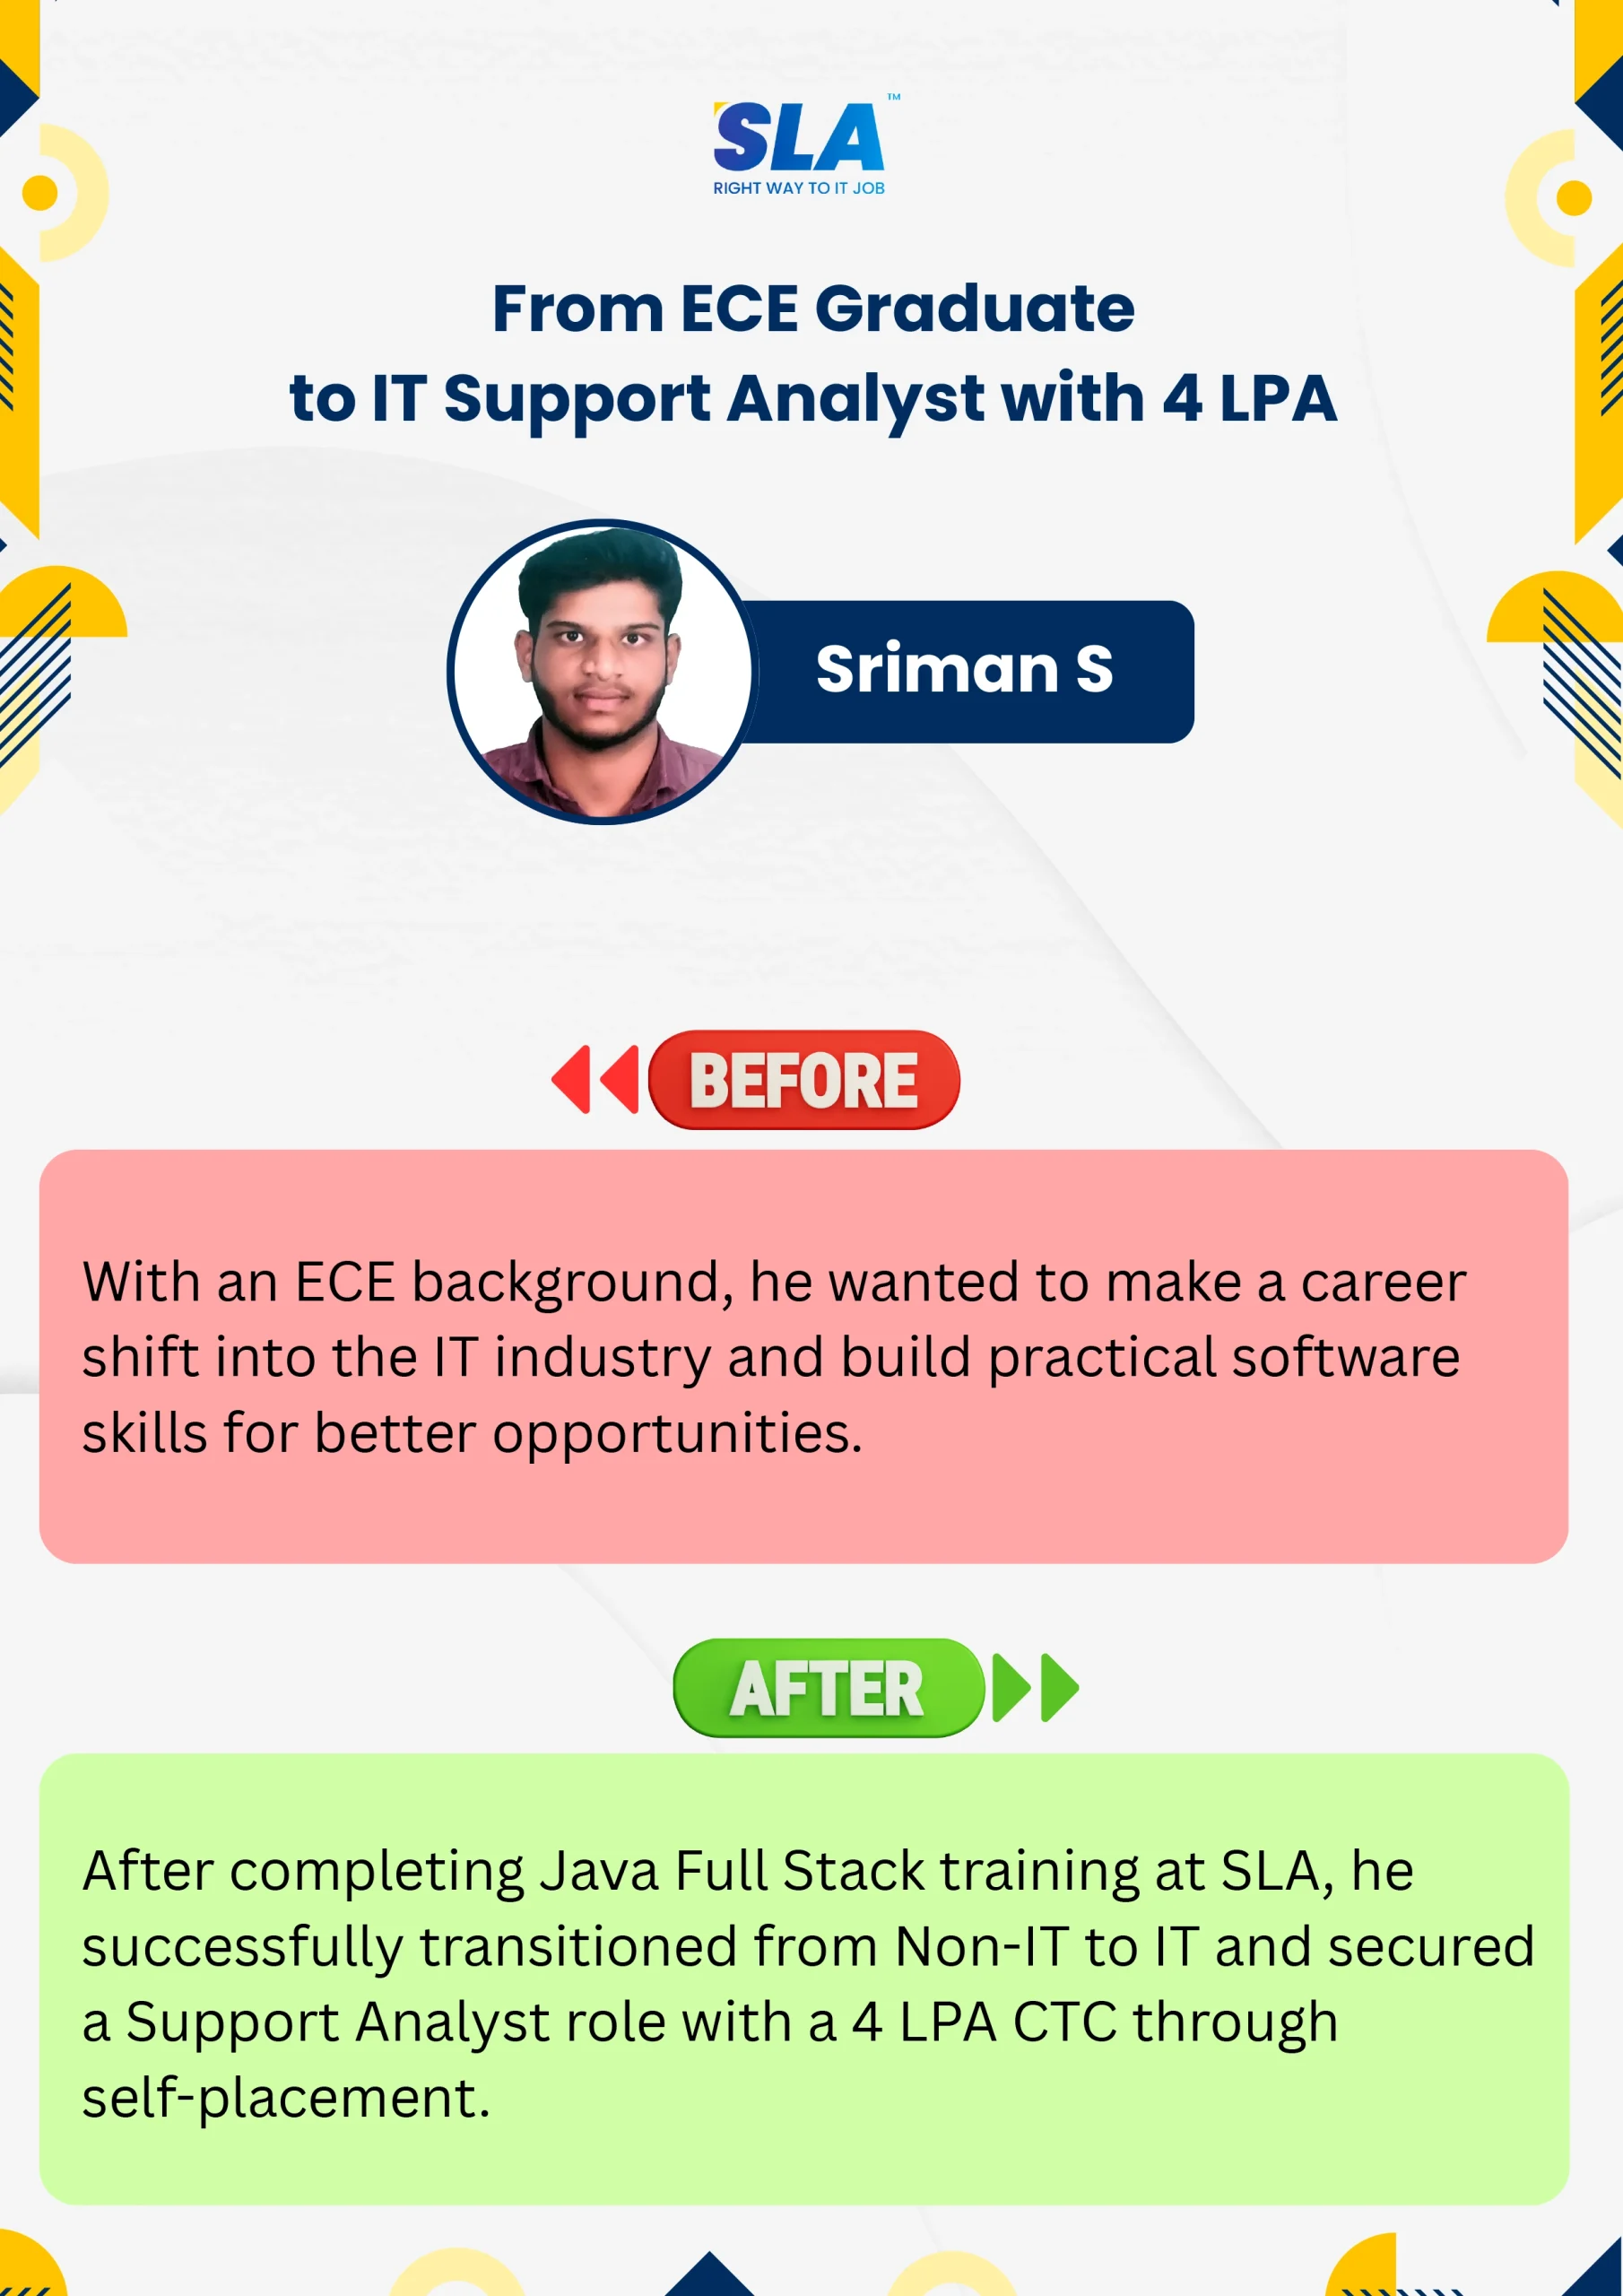
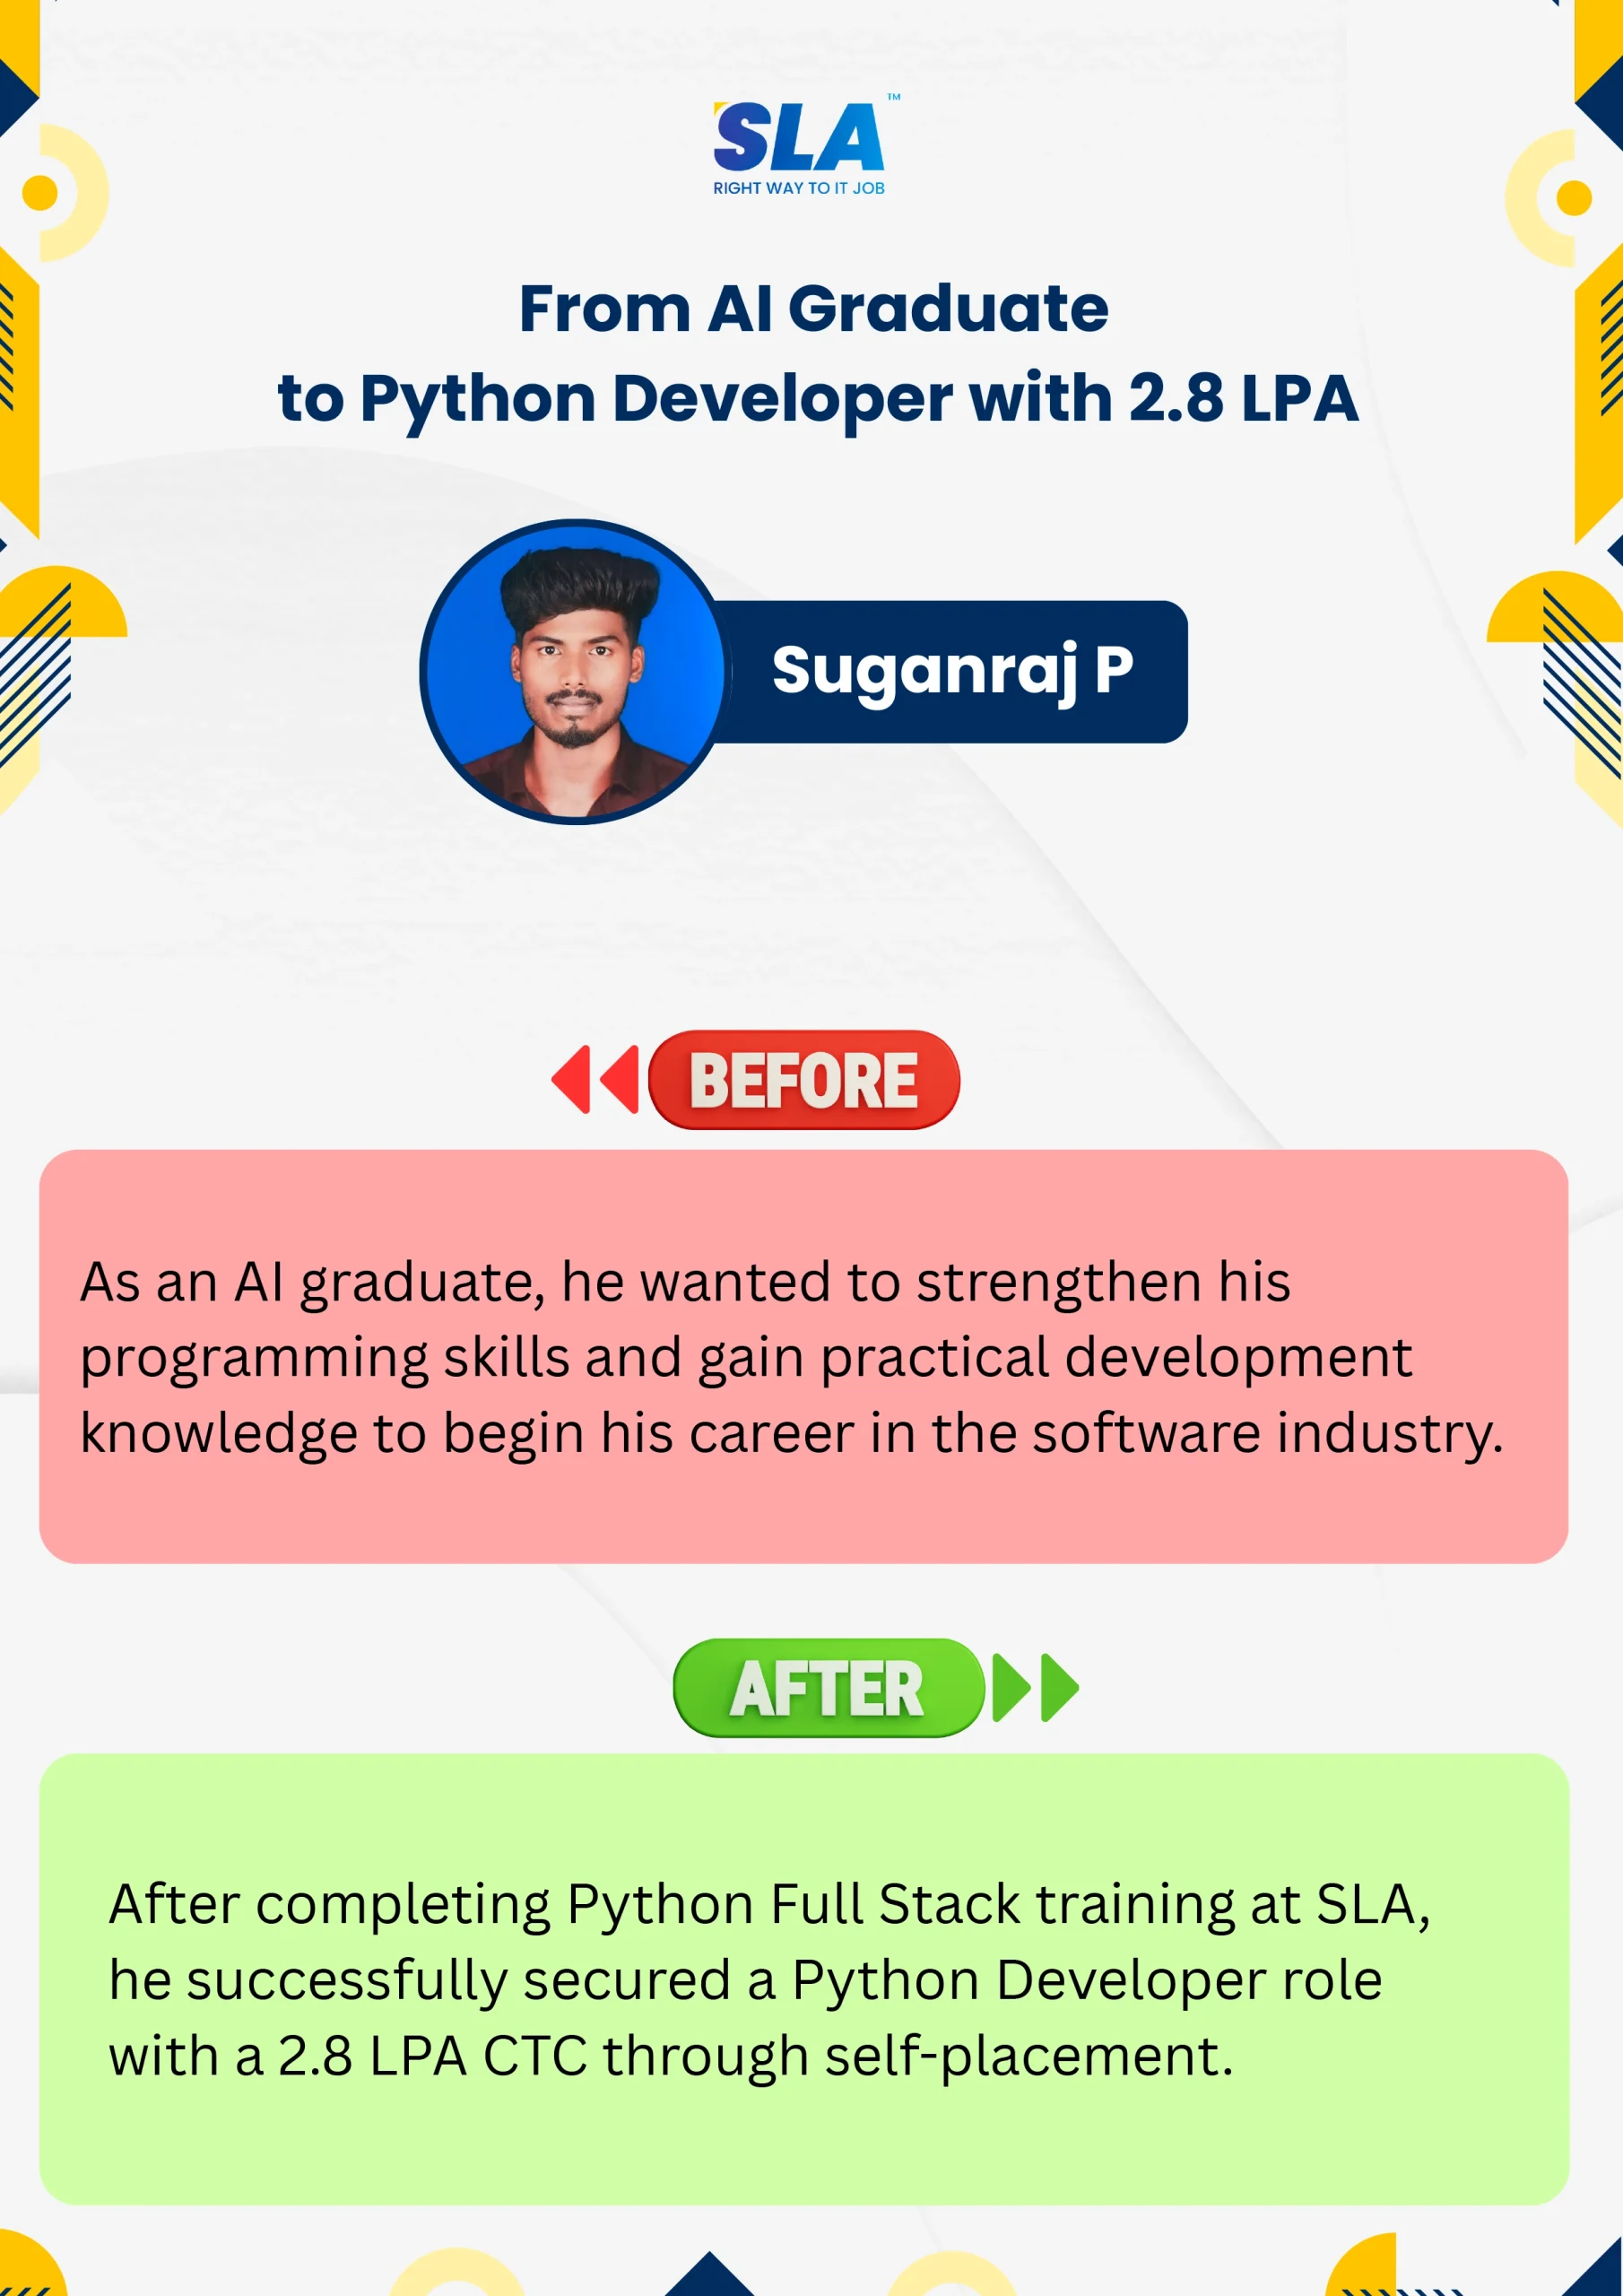
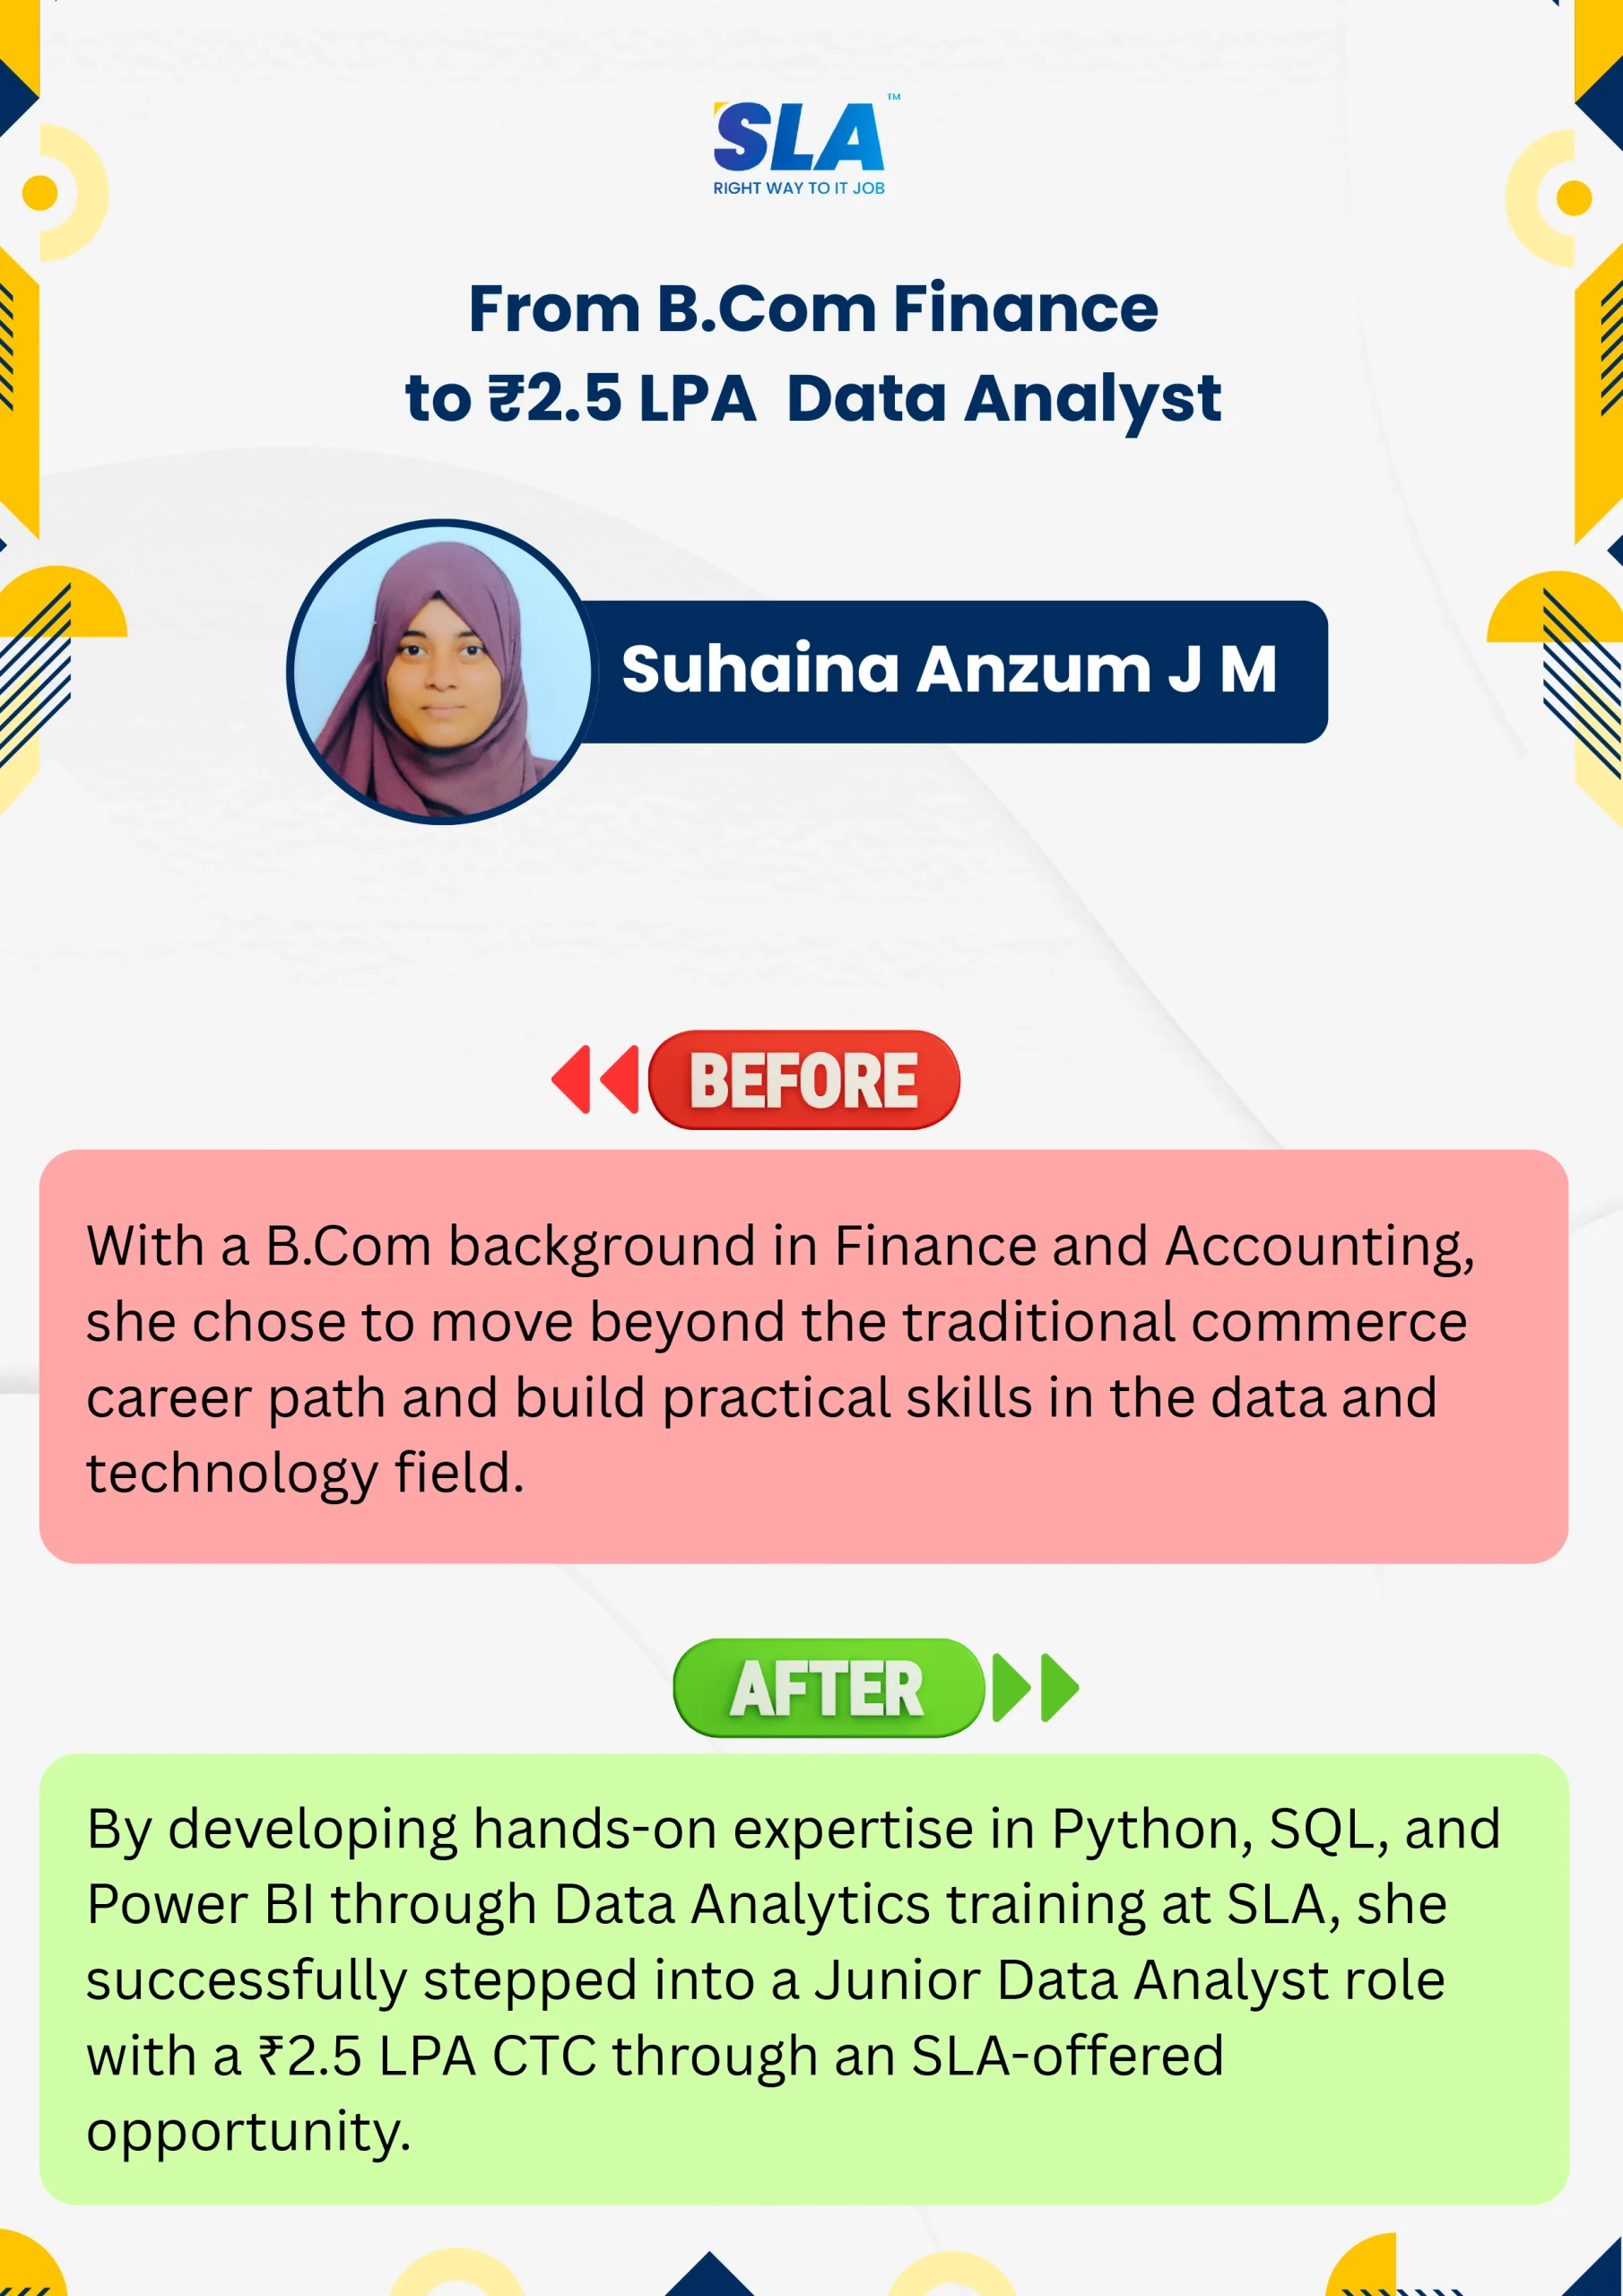
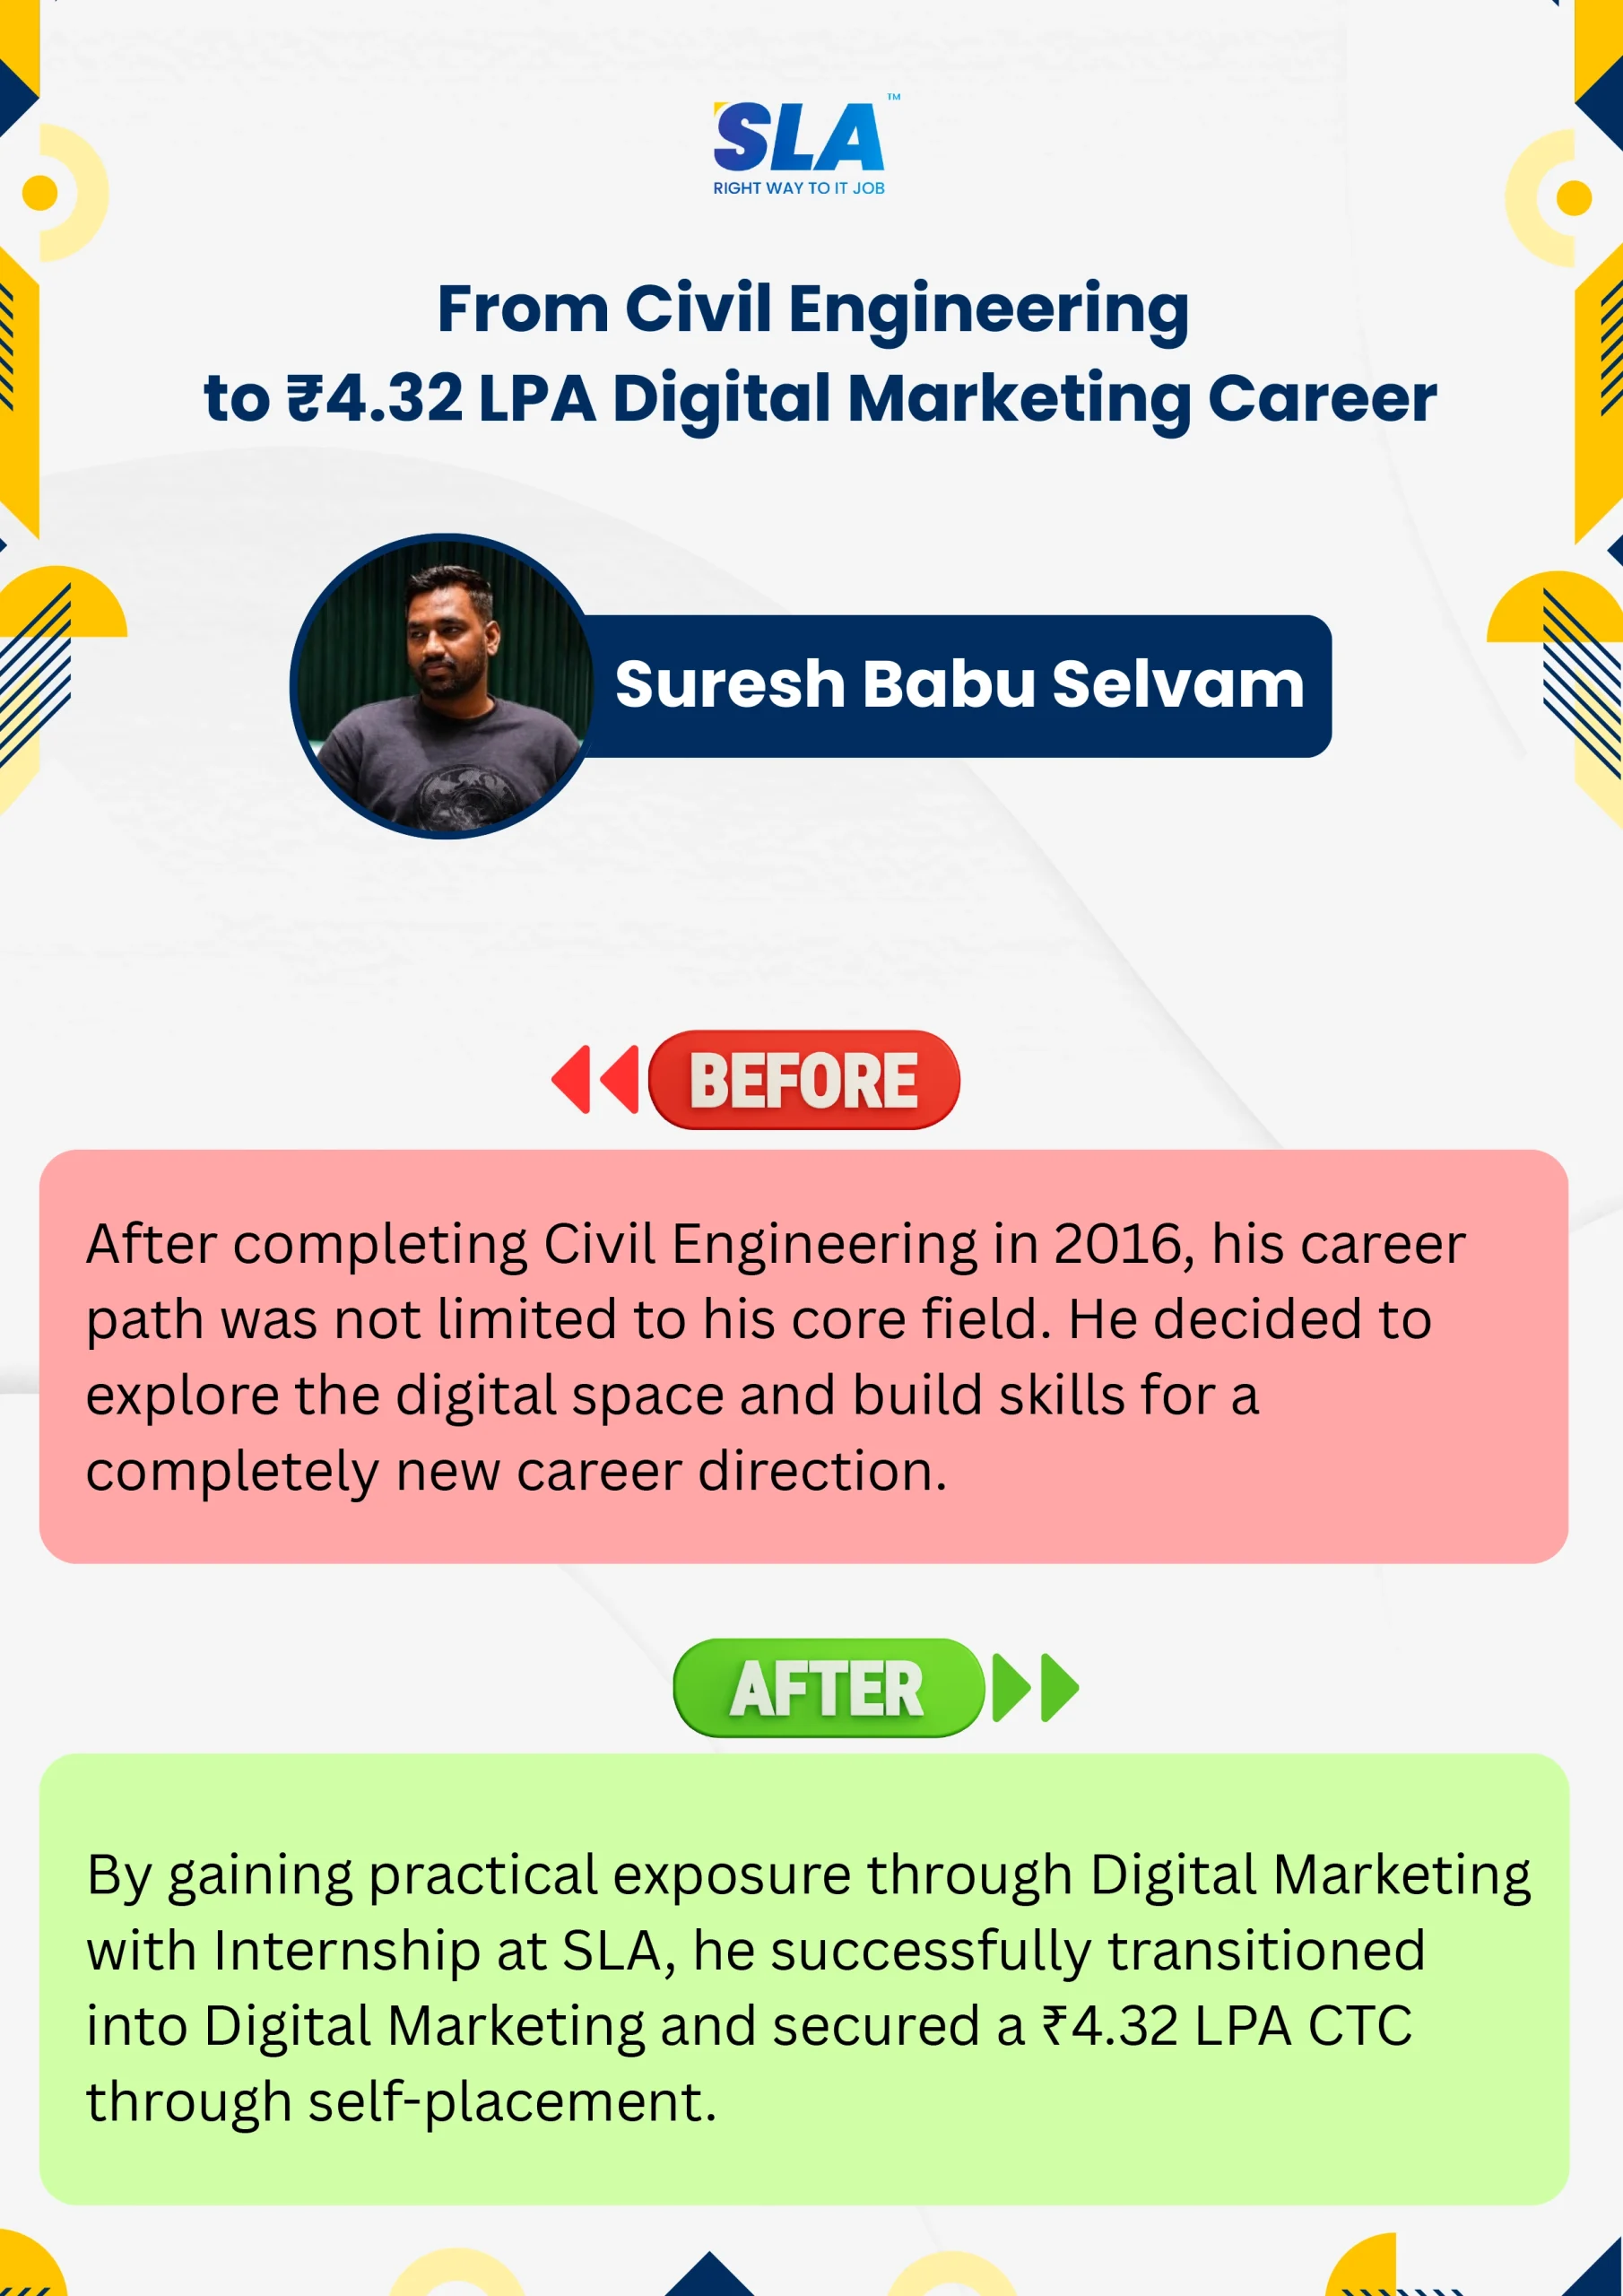
Life Changing Stories

Explore Our Students' Inspiring Leap Stories!

See More Success Stories

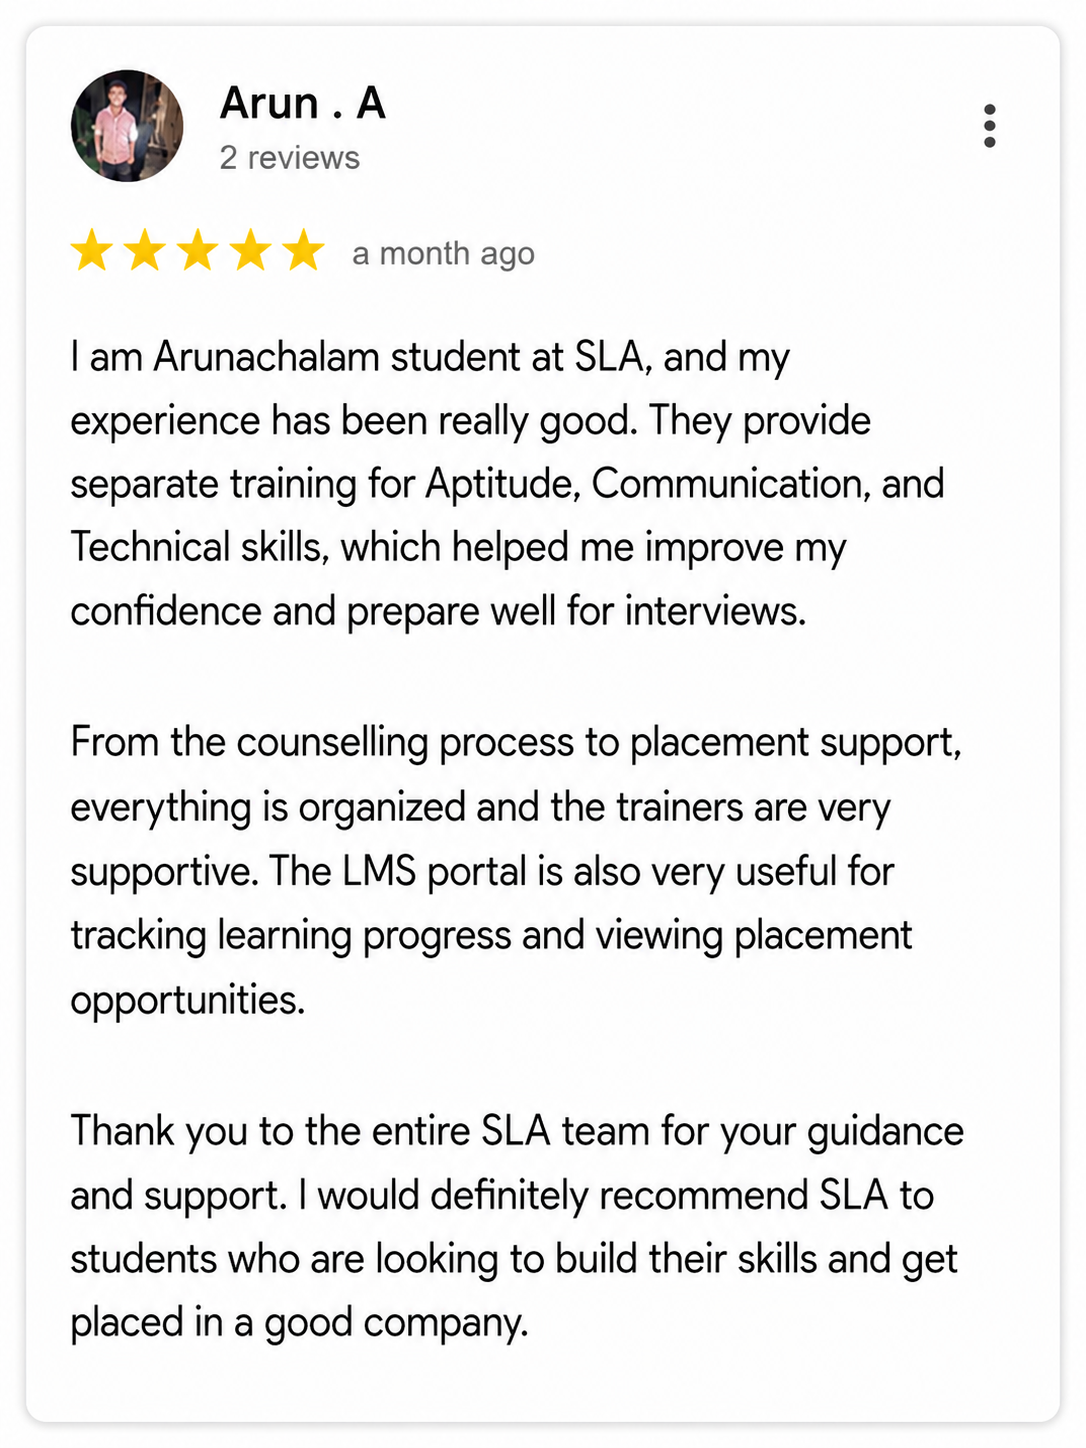
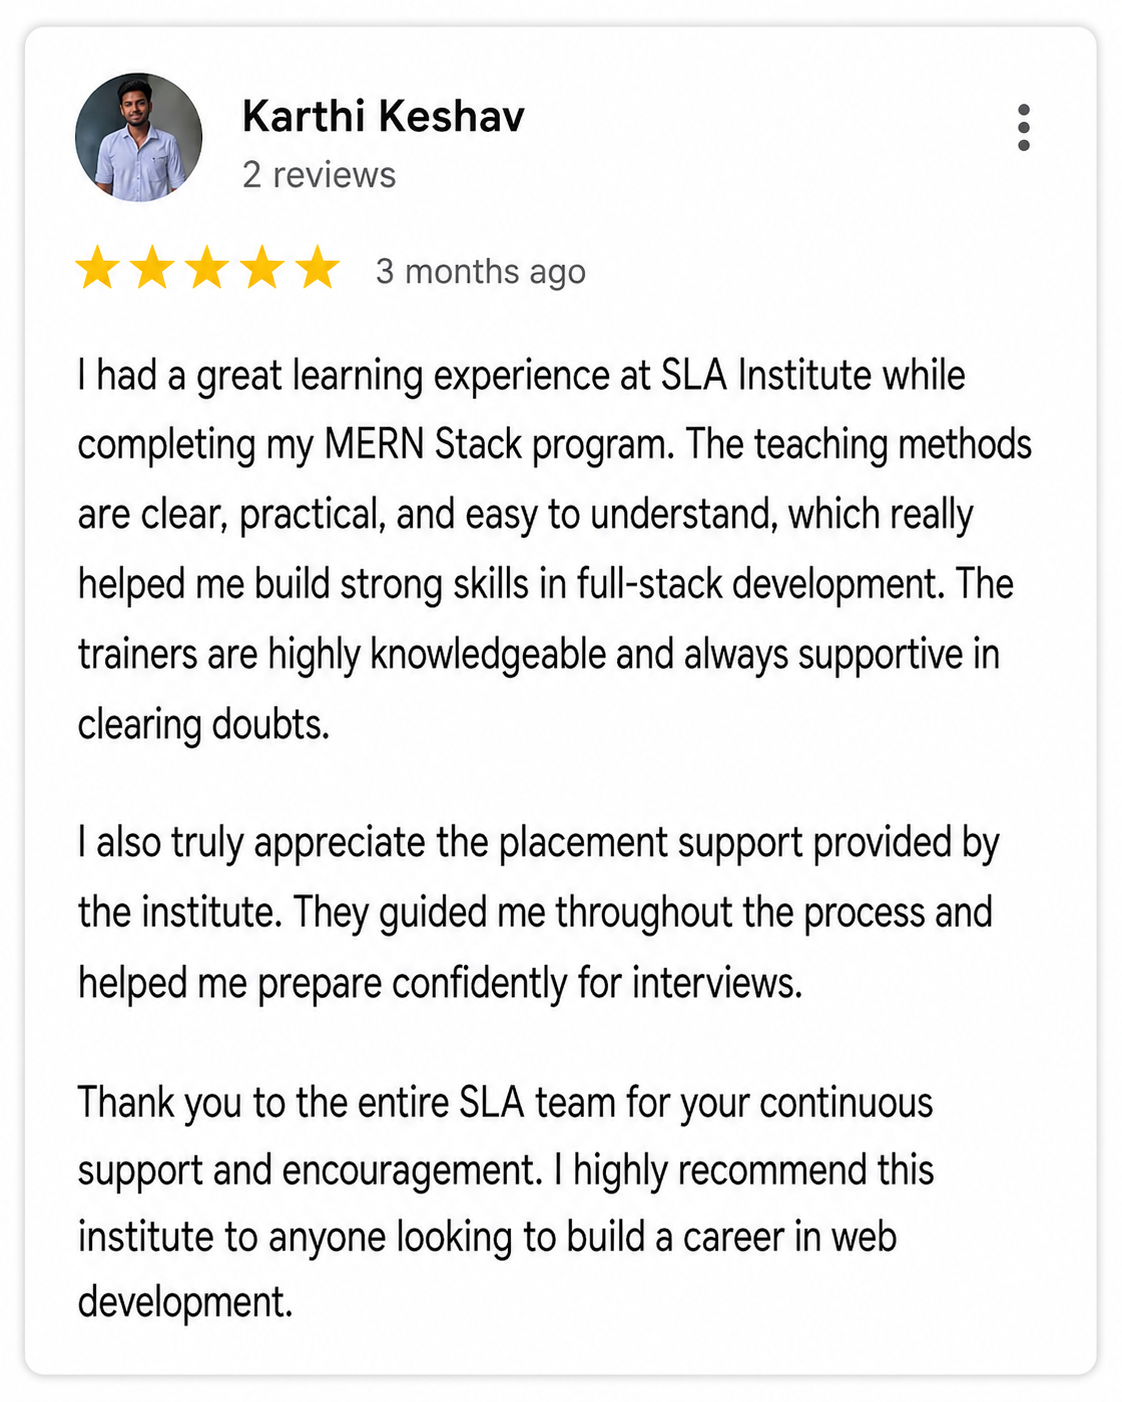
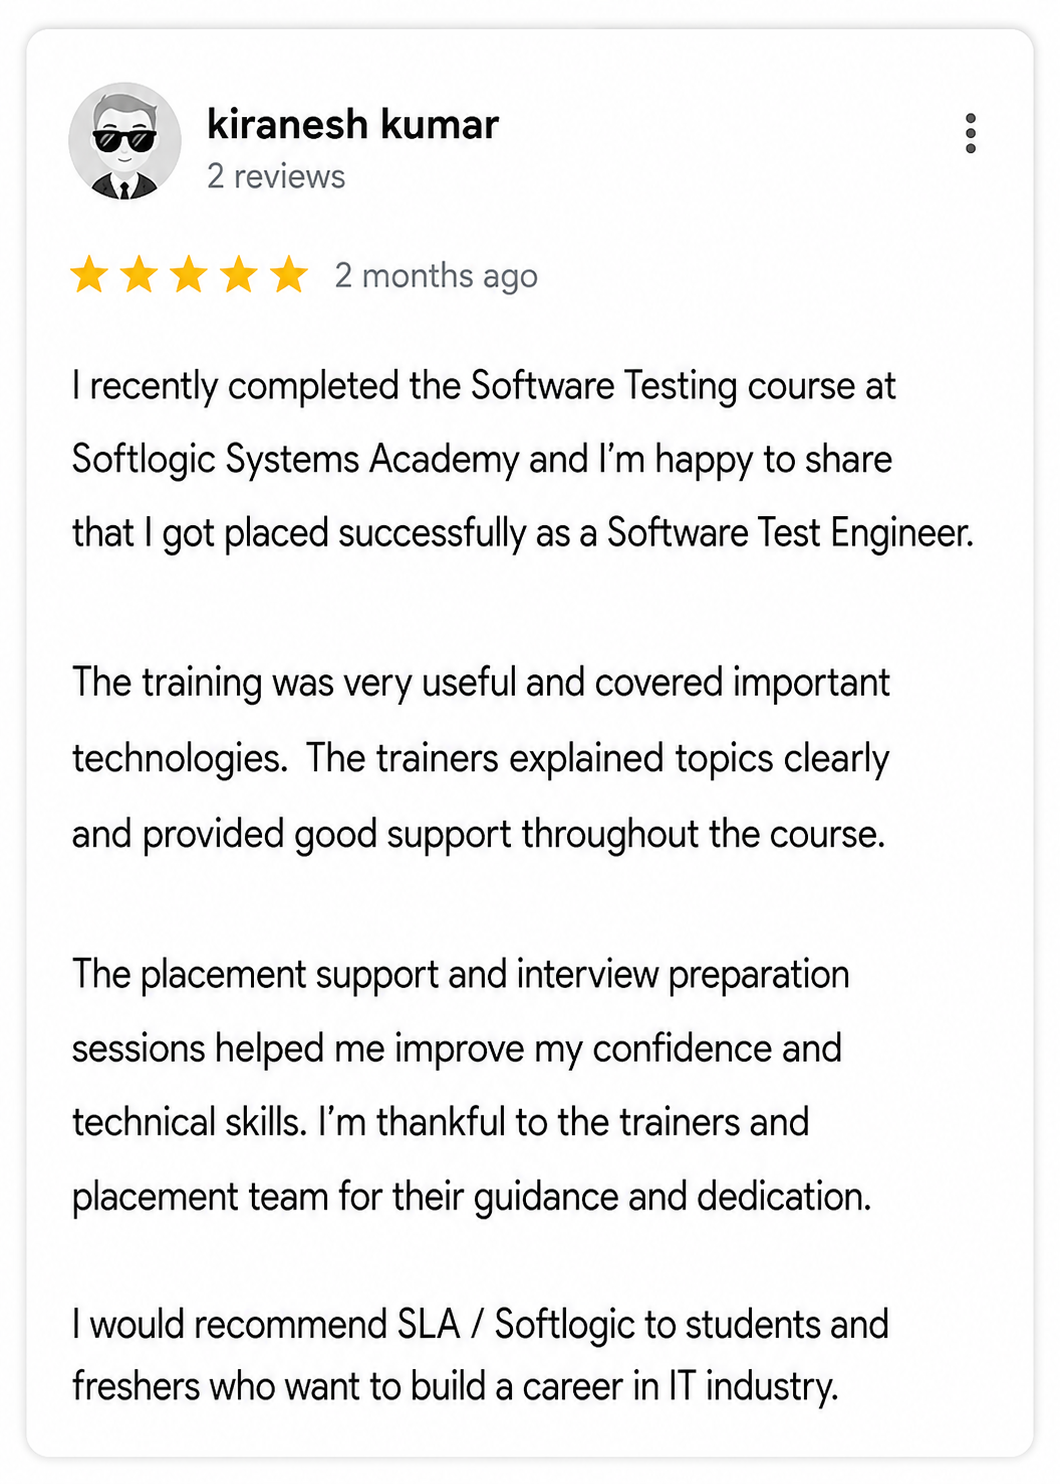
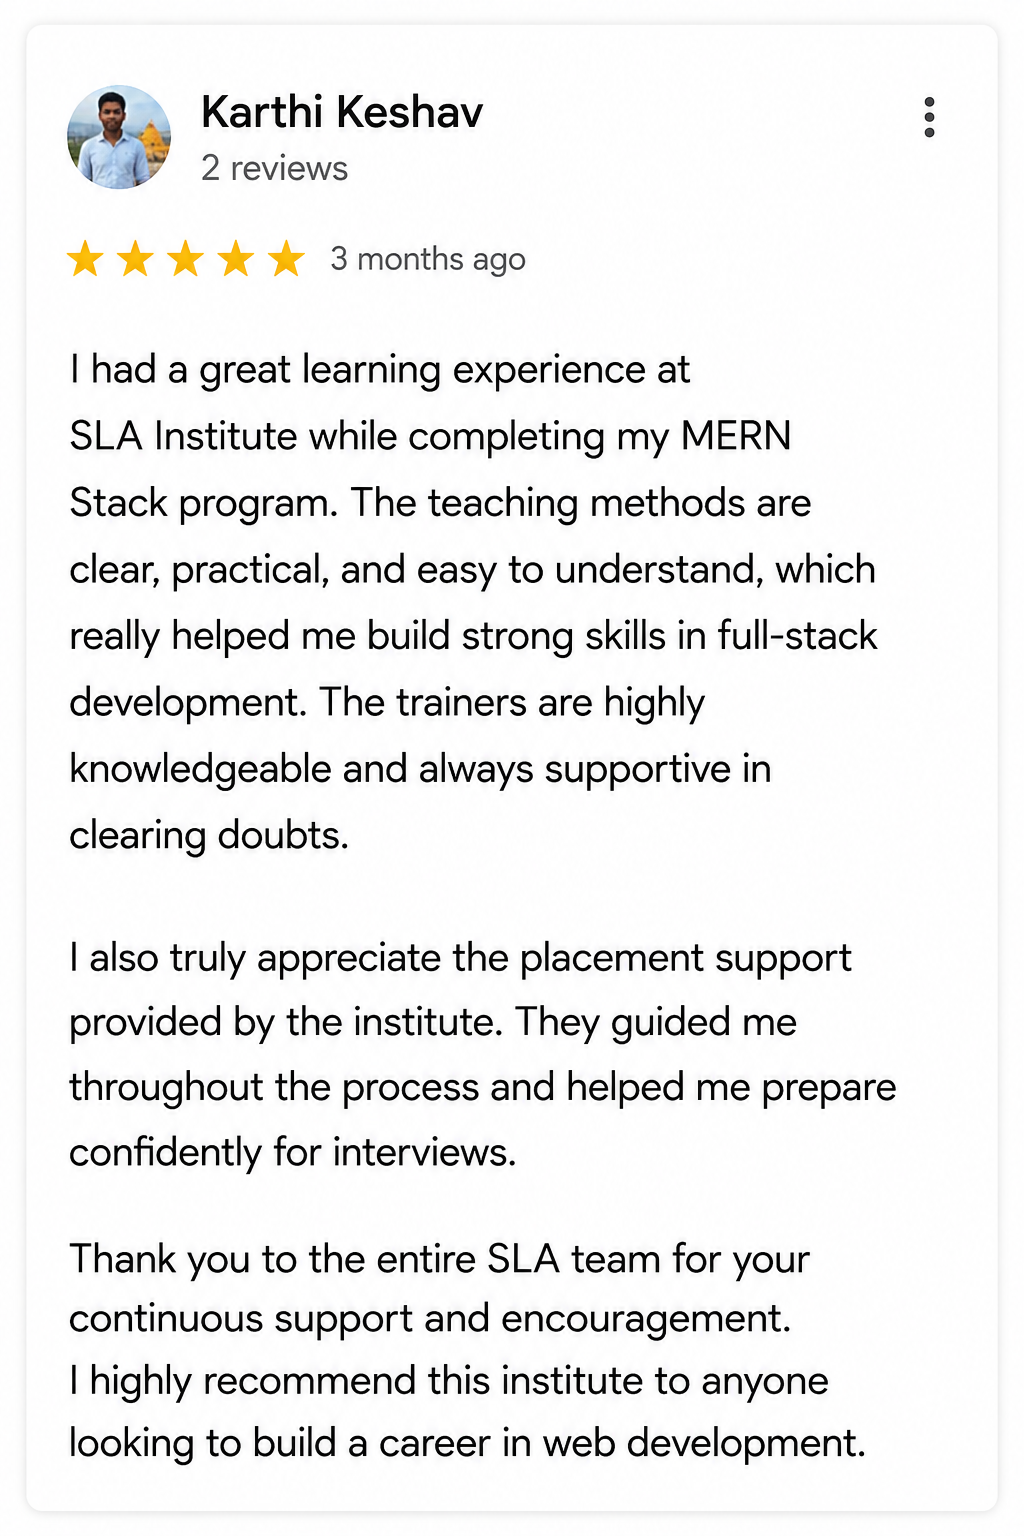
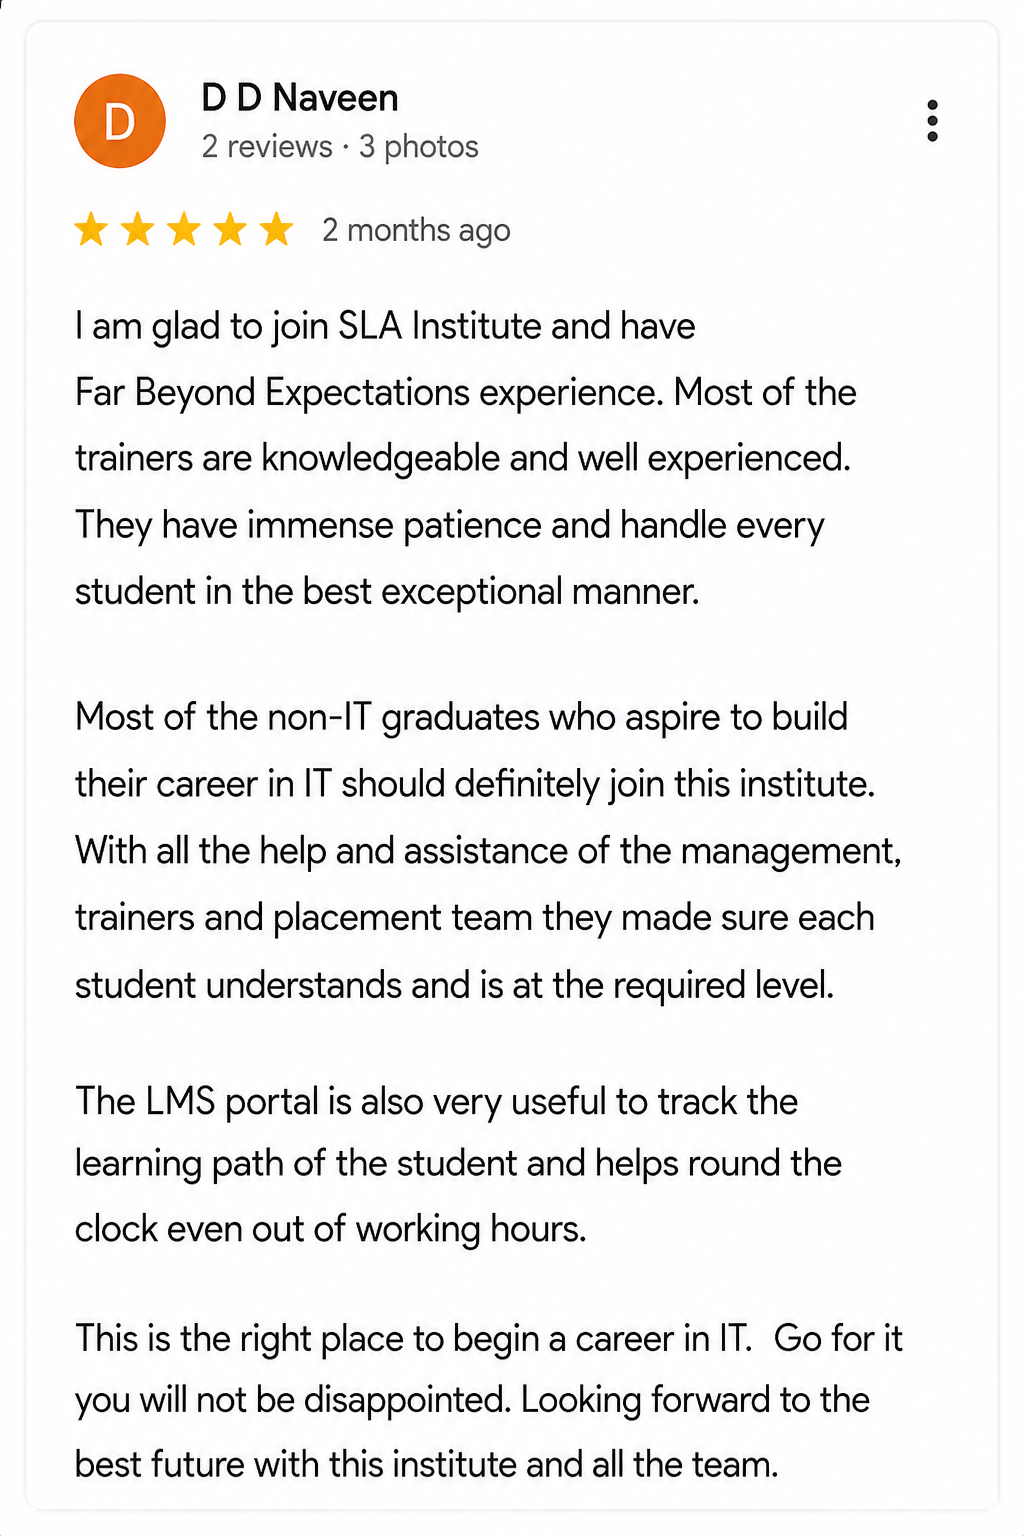
Check our Google Reviews

3D Coverflow Carousel
Review Image
Click here to view all Reviews

Syllabus of Data Analytics Course In Chennai

Download Syllabus
  • Python Introduction & history
  • Color coding schemes
  • Salient features & flavors
  • Application types
  • Language components
  • String handling management
    • String operations – indexing, slicing, ranging
    • String methods – concatenation, repetition, formatting
    • Supporting functions
  • Native data types
    • List
    • Tuple
    • Set
    • Dictionary
  • Decision making statements
    • If
    • If…else
    • If…elif…else
  • Looping statements
    • For loop
    • While loop
  • Function types
    • Built-in functions
    • Math functions
    • User defined functions
    • Recursive functions
    • Lambda functions
  • OOPs
    • Classes and objects
    • init constructor
    • Self-keyword
    • Data abstraction
    • Data encapsulation
    • Polymorphism
    • Inheritance
  • Exception handling
    • Error vs exception
    • Types of error
    • User defined exception handling
    • Exception handler components
    • Try block, except block, finally block
  • Data Visualization
  • Reporting Business Intelligence (BI)
  • Traditional BI
  • Self-Serviced BI Cloud Based BI
  • On Premise BI
  • Power BI Products
  • Power BI Desktop (Power Query, Power Pivot, Power View)
  • Flow of Work in Power BI Desktop
  • Power BI Report Server
  • Power BI Service, Power BI Mobile
  • Power BI Architecture
  • A Brief History of Power BI
  • Data Transformation
  • Benefits of Data Transformation
  • Shape or Transform Data using Power Query
  • Overview of Power Query / Query Editor
  • Query Editor User Interface
  • The Ribbon (Home, Transform, Add Column, View Tabs)
  • The Queries Pane
  • The Data View / Results Pane
  • The Query Settings Pane, Formula
  • Bar Saving the Work
  • Data types
  • Changing the Data type of a Column Filters in Power Query
  • Auto Filter / Basic Filtering Filter a Column using
  • Text Filters Filter a Column using Number Filters
  • Filter a Column using Date Filters Filter Multiple Columns
  • Remove Columns / Remove Other Columns Name
  • Rename a Column Reorder Columns or Sort Columns
  • Add Column / Custom Column Split Columns Merge
  • Columns PIVOT, UNPIVOT Columns Transpose Columns
  • Header Row or Use First Row as Headers Keep Top Rows
  • Keep Bottom Rows Keep Range of Rows Keep Duplicates
  • Keep Errors Remove Top Rows
  • Remove Bottom Rows
  • Remove Alternative Rows
  • Remove Duplicates, Remove Blank Rows
  • Remove Errors Group Rows / Group By
  • IF..ELSE Conditions
  • TransformColumn()
  • RemoveColumns()
  • SplitColumns()
  • ReplaceValue()
  • Table.Distinct() Options and GROUP BY Options
  • Table.Group()
  • Table.Sort() with Type Conversions
  • PIVOT Operation and Table.Pivot ().
  • List Functions Using Parameters with M Language
  • Data Modeling Introduction Relationship
  • Need of Relationship Relationship Types
  • Cardinality in General
    • One-to-One
    • One-to-Many
    • Many-to-One
    • Many-to-Many
  • AutoDetect the relationship
  • Create a new relationship
  • Edit existing relationships
  • Make Relationship Active or Inactive
  • Delete a relationship
  • What is DAX
  • Calculated Column, Measures
  • DAX Table and Column Name Syntax
  • Creating Calculated Columns
  • Creating Measures
  • Calculated Columns Vs Measures
  • DAX Syntax & Operators
  • Types of Operators
    • Arithmetic Operators
    • Comparison Operators
    • Text Concatenation Operator
    • Logical Operators
  • Date and Time Functions
    • YEAR, MONTH,DAY
    • WEEKDAY, WEEKNUM FORMAT (Text Function)
    • Month Name, Weekday Name
    • IF
    • TRUE, FALSE NOT,
    • OR, IN, AND
  • Text Function
    • LEN, CONCATENATE
    • LEFT, RIGHT, MID UPPER
    • LOWER TRIM, SUBSTITUTE, BLANK
  • Logical Functions
    • IF TRUE, FALSE NOT
    • OR, IN, AND IF ERROR SWITCH
  • Math & Statistical Functions
    • INT ROUND, ROUNDUP
    • ROUNDDOWN
    • DIVIDE EVEN, ODD
    • POWER, SIGN SQRT
    • FACT SUM, SUMX MIN, MINX MAX
    • MAXX COUNT,
    • COUNTX AVERAGE
    • AVERAGEX COUNTROWS
    • COUNTBLANK
  • Report View User Interface
  • Fields Pane
  • Visualizations pane
  • Ribbon, Views, Pages Tab
  • Canvas Visual Interactions Interaction Type (Filter, Highlight, None)
  • Visual Interactions Default Behavior, Changing the Interaction
  • Grouping and Binning Introduction
  • Using grouping, Creating Groups on Text Columns
  • Using binning, Creating Bins on Number Column and Date Columns
  • Sorting Data in Visuals
  • Changing the Sort Column
  • Changing the Sort Order
  • Sort using column that is not used in the Visualization
  • Sort using the Sort by Column button
  • Hierarchy Introduction
  • Default Date Hierarchy
  • Creating Hierarchy
  • Creating Custom Date Hierarchy
  • REPORT VIEW
  • Change Hierarchy Levels
  • Drill-Up and Drill-Down Reports
  • Data Actions, Drill Down, Drill Up, Show Next Level
  • Expand Next Level Drilling filters other visuals option
  • Visualizing Data
  • Why Visualizations
  • Visualization types
  • Create and Format Bar and Column Charts
  • Create and Format Stacked Bar Chart
  • Stacked Column Chart
  • Create and Format Clustered Bar Chart
  • Clustered Column Chart
  • Create and Format 100% Stacked Bar Chart 100% Stacked Column Chart
  • Create and Format Pie and Donut Charts
  • Create and Format Scatter Charts
  • Create and Format Table Visual
  • Matrix Visualization
  • Line and Area Charts
  • Create and Format Line Chart, Area Chart
  • Stacked Area Chart Combo Charts
  • VISUALIZATIONS
  • Create and Format Line and Stacked Column Chart
  • Line and Clustered Column Chart
  • Create and Format Ribbon Chart
  • Waterfall Chart, Funnel Chart
  • Power BI Service Introduction
  • Power BI Cloud Architecture
  • Creating Power BI Service Account
  • SIGN IN to Power BI Service Account
  • Publishing Reports to the Power BI service
  • Import / Getting the Report to PBI Service
  • My Workspace / App Workspaces Tabs
  • DATASETS, WORKBOOKS, REPORTS & DASHBOARDS
  • Working with Datasets Creating Reports in Cloud using Published
  • Datasets
  • Creating Dashboards Pin Visuals and Pin LIVE
  • Report Pages to Dashboard
  • Advantages of Dashboards Interacting with
  • Dashboards
  • Formatting Dashboard, Sharing Dashboard
  • Group by()
  • Pivot tables()
  • Multi-indexing()
  • merge()
  • concatenate()
  • join()
  • data transformation using apply()
  • map()
  • query()
  • Resampling time series functionality
  • excel writer()
  • pipe()
  • creating dataframes
  • reading CSV files with intrinsic index
  • converting CSV files to dataframes
  • converting dataframes to CSV files
  • converting dataframes to excel file
  • Common Table Expressions (CTE)
  • Recursive CTE’s
  • temporary functions
  • pivoting data with sum() and CASE WHEN
  • Except vs Not in
  • self joins, rank vs dense_rank vs row number
  • ranking data
  • calculating delta values,
  • multiple groupings using rollup
  • calculating running totals
  • computing a moving average
  • date time manipulations
  • Formatting strings, stored methods
  • JOINS
  • Sub Queries
  • Manipulation of date and time
  • procedural data storage
  • Connecting SQL to Python or R language, window Functions
  • Project1 – Product Sales Analysis – Power BI Project and review
  • Project2 – Financial Performance Analysis – Power BI Project and review
  • Project3 – Health care sales Analysis –
  • Intermediate Power BI project and review
  • Project4 – Anamoly detection in Credit card transactions – Intermediate Power BI project and review

Objectives of Data Analytics Course In Chennai

The main objective of the Data Analytics course is to make students fully well-versed on the subject of Data Analytics. Students will get the opportunity to learn from the newly updated Data Analytics syllabus where they will learn interesting topics like: Hadoop ecosystem, HiveQL, AzureML and more.

By the time students complete this course they will be knowledgeable on the following:

  • Querying Data with Hive
  • Big Data & Machine Learning
  • Handling files in Hadoop
Click Here to Get Started

Highlights of Data Analytics Course In Chennai?

Data analytics transforms unprocessed data into practical insights. It encompasses an array of tools, technologies, and methodologies employed to uncover patterns and address issues through data utilization. Data analytics has the power to mold operational procedures, enhance informed choices, and cultivate the expansion of enterprises.

There are several compelling reasons to learn data analytics:

  • Career Opportunities: Embark on a data-driven journey, unraveling mysteries and ascending the ladder of professional success.
  • Evolving Job Market: Enter the data analytics education time capsule and secure your perpetual relevance in a job market that constantly shifts and transforms.
  • Informed Decision-Making: Tap into the potential of data analytics to make decisions as precise as a fortune teller and as confident as an experienced strategist.
  • Problem-Solving: Excel in the skill of transforming data into solutions and proudly don the mantle of a digital hero, saving companies from the turmoil of data complexity.

While there are no prerequisites for learning Data Analytics at our Data Analytics Training in Chennai it is highly advantageous to have a foundational knowledge in Statistics and Programming languages.

Data Analytics Training is typically suitable for individuals from various backgrounds who possess an interest in data and aspire to learn data analytics as a skill set.

  • Students
  • Professionals switching careers
  • IT professionals who want to advance their skills
  • Job Hunters

The fees for our Data Analyst Course may vary depending on the program level (basic, intermediate, or advanced) and the course format (online or in-person). On average, Data Analytics Certification Course Fees are affordable and lasts for 2 Months including international certification. For precise and up-to-date information on fees, duration, and certification, please contact our Business Analytics Course directly.

Certainly, here are a few job positions associated with data analytics:

  • Data Analyst
  • Business Analyst
  • Market Research Analyst
  • Business Intelligence Analyst
  • Marketing Analyst
  • Web Analyst
  • Social Media Analyst

Certainly, here are a few examples of real-time applications that leverage data analytics:

  • E-commerce Platforms (e.g., Amazon, eBay)
  • Traffic Navigation Apps (e.g., Google Maps, Waze)
  • Streaming Platforms (e.g., Netflix, Spotify)
  • Emergency Response Systems (e.g., 911 services)
  • Healthcare Monitoring Devices (e.g., Apple Ride-Sharing Apps (e.g., Uber, Lyft)Watch, Garmin)
  • Energy Management Systems (e.g., Schneider Electric, Siemens)

As per data from AmbitionBox, the Data Analyst freshers salary typically with less than 2 years of experience earn approximately ₹3-5 lakhs annually. For mid-career Data Analysts with around 3 years of experience, the average annual salary is around ₹6 lakhs. An experienced Data Analyst with more than 5 years of experience can anticipate an average yearly salary of around ₹8.3 lakhs.

Boost your skills with Data Analytics Course In Chennai with Experts

Our Mentors are from Top Companies like:
  • Our Data Analytics trainers are highly trained professionals in the field of analytics, with deep technical knowledge and expertise.
  • They have vast experience in managing and implementing data-driven solutions.
  • They create comprehensive study materials to help learners learn the fundamentals of data analytics and understand the available possibilities in different analytical domains.
  • Our trainers have a thorough understanding of data analytics certification, and train students on the concepts of data exploration, machine learning algorithms, fundamental concepts of Big Data and data visualization.
  • They are highly proficient in preparing the students for the certification exams by engaging in teaching through real-life scenario based learning and mentoring.
  • Our trainers exhibit great communication and interpersonal skills to ensure effective instruction and learning with students.
  • They have the ability to deploy secure and powerful data solutions and configure servers in high-performance computing.
  • They also have the ability to develop and deploy applications with the software development life cycle.
  • Data Analytics trainers make use of analytics platforms and techniques to assess student performance and provide feedback to help them nurture their analytics skills.
  • The trainers have a team oriented approach and enthusiasm towards helping students gain the required knowledge and get placed in their dream jobs easily.
Click Here to Get Started

Explore Real Projects Built by Softlogic Students

Explore the real-world, enterprise-level projects designed and executed by our successful alumni. Gain the same hands-on exposure to live industry projects, build a standout portfolio, and prove your practical skills to top hiring managers instantly.
Dynamic Pricing
Price Optimization
Sales Forecasting
Project Practices for Data Analytics Course In Chennai

Why Softlogic Systems is the Best Choice for Data Analytics Course In Chennai

Crowdfunding Platform
Online & Offline Training Options
Learn at your convenience with flexible classroom and live online training.
Learn from 100+ Real-Time Developers
Get trained by industry professionals with years of hands-on experience.
Voting System with Python Django
Hands-on Projects & Codeathons
Practice with real-time projects and coding challenges to build confidence.
0% EMI Fee Options
Pay your course fees flexibly with easy EMI plans at zero interest.
Resume & Interview Support
Get expert help with resume building, mock interviews, and soft skills.
Placement with Top IT Firms
Access placement opportunities with leading MNCs and IT companies.
500+ Hiring Partners
Benefit from Softlogic’s strong recruiter network for faster job placement.
No Backdoor Jobs
We ensure only genuine placement opportunities with trusted companies.
Request a Free Callback

Certifications

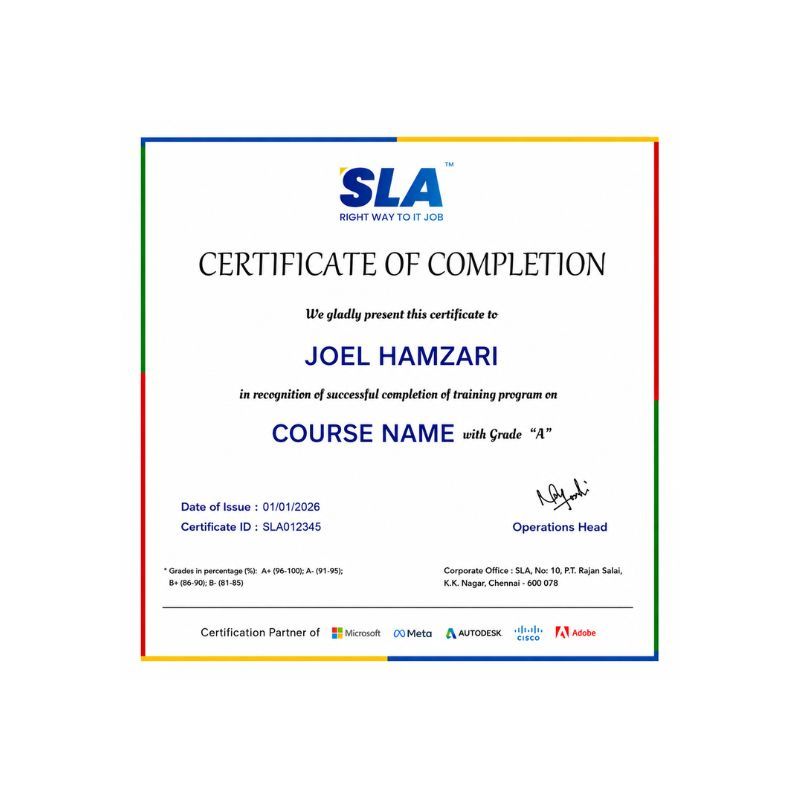
Earn Your Certificate of Completion
Validate your achievements with Softlogic's Certificate of Completion, verifying successful fulfillment of all essential components.
Take Your Career to the Next Level with  Certifications
Get a certifications through our training programs to gain a competitive edge in the industry.
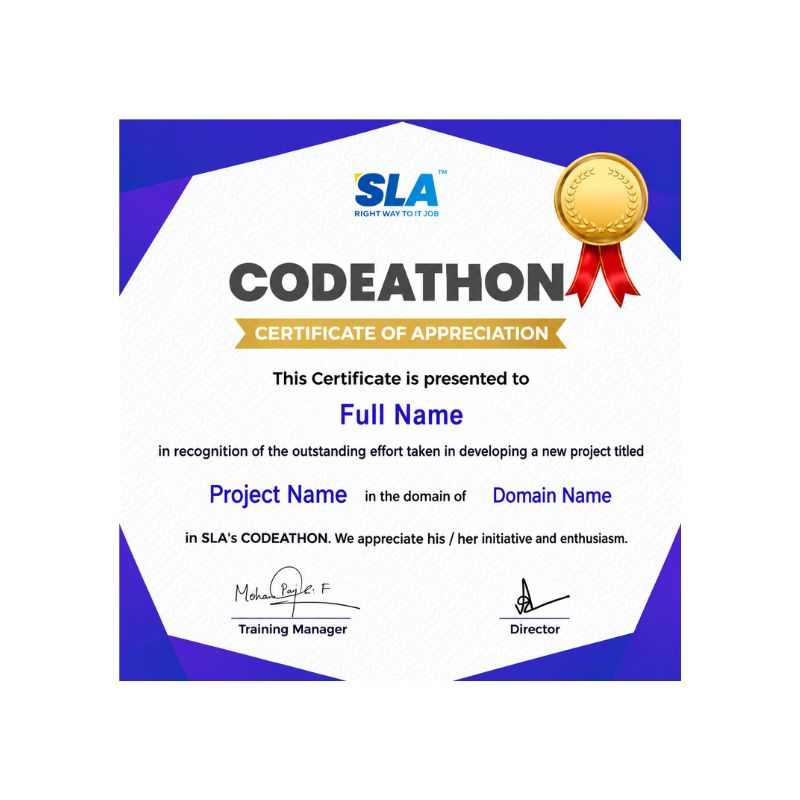
Stand Out from the Crowd with Codethon Certificate
Verify the authenticity of your real-time projects with Softlogic's Codethon certificate.

The Global Edge: Certified Vs. Uncertified

With Global Certification

  • ✅ Visibility in ATS Filters
  • ✅Command Higher Hikes
  • ✅ Verified Skill Proof
  • ✅Global Job Access
  • ✅ Fast-Tracked Senior Roles

Without Global Certification

  • ❌ Stuck in Screening
  • ❌ Lower Starting Pay
  • ❌ Unproven Technical Ability
  • ❌ Limited Local Scope
  • ❌ Slower Career Leader
  •  
Let's take the First Step to a better future! GET Free Career Guidance
The SLA Way to Get Placed

The SLA Way to Get Placed

Seven connected stages, one continuous path from enrollment to your career launch — here is exactly how it works, step by step.

01
🎓

Technical Mastery

Industry-aligned curriculum, daily coding tasks, real-time projects

02
💻

Career Readiness

Aptitude, Communication, ATS-friendly resume optimization

03
🎯

Placement Prep

Aptitude, communication tuning and technical interview mastery.

04
💬

Panel Mock Interviews

Real company-pattern mocks with expert panel feedback.

05
👨‍💼

Interview schedule

Multiple company drives with lifetime placement support.

06
📝

Interview Feedback

Detailed performance analysis and one-on-one guidance.

07
🏆

Launch Your Career

Land your first job with lifetime alumni and career support.

Listen to Our Students' Video Testimonials

FAQ

Call +91 86818 84318 right away and find out all about the great deals that are now available to you!

Through this Data Analytics Training you will learn the fundamentals of data science, machine learning, and artificial intelligence, as well as the art of communication within the data-driven organization. Additionally, the course will cover topics such as data collection, distribution, and visualization.

Data analytics allows businesses to identify trends and relationships in data that were previously hidden. By using this data to improve decision making, organizations can make better use of resources, optimize operations, gain a competitive edge, and increase revenues and profits.

Data Analytics is the practice of extracting insights from data. Data Science is an interdisciplinary field that combines data engineering, computer science and analytics to solve complex issues. Data Science also uses algorithms to create predictions based on data.

During this training, you will learn to use R and Python for data analysis, machine learning, and artificial intelligence.

This training is intended for anyone who wants to gain practical knowledge in data analytics and harness it for business value. It is suitable for those who enter data science as well as experienced data analysts.

This training offers an overview suitable for all levels of expertise, from beginners to experts. You will explore the latest technologies and techniques used by the world’s leading data scientists.

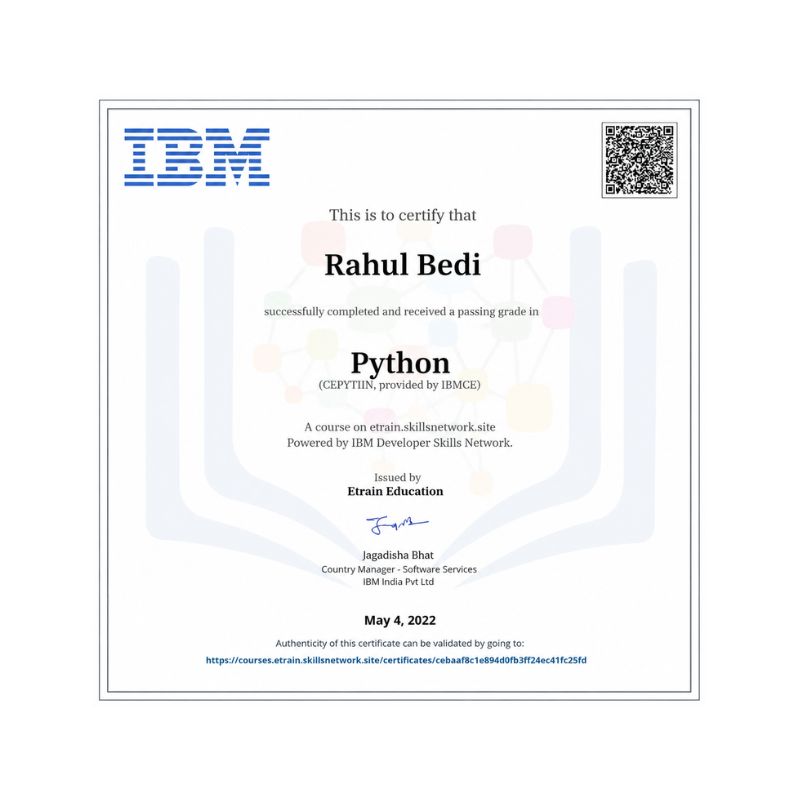
Yes, this Data Analytics Training is certified by IBM, and you will receive a certification upon successful completion of the course.

Softlogic System is a leading provider of data analytics training and certification. Our experienced team of trainers has deep expertise in the field, and offers cutting-edge and up-to-date knowledge.

After completing this Data Analytics Training, you will be well positioned to apply for a range of data-related jobs within various industries. These include positions such as Data Scientist, Data Analyst, Business Intelligence Analyst, Machine Learning Engineer, and Artificial Intelligence Engineer.

Related Blogs

Our counselors will share the Syllabus PDF with you via Email / Whatsapp

Get Your Instant Job & Placement Eligibility
Report in Just 30 Seconds!

We are excited to get started with you

Give us your information and we will arange for a free call (at your convenience) with one of our counsellors. You can get all your queries answered before deciding to join SLA and move your career forward.