
Software Training Institute in Chennai with 100% Placements – SLA Institute

Data Analytics Online Training

4.80
(2147)

Our Data Analytics Online Training programs are designed for students, freshers, and working professionals who want to upskill and stay relevant. We offer Data Analytics Online Courses that are practical, interactive, and aligned with the latest industry demands. Our Data Analytics Syllabus covers the data analytics fundamentals, statistical analysis, data visualization, SQL, Excel, Python for analytics, and business intelligence tools. Enroll now and learn from industry experts with flexible timings and get Job support.


DURATION
Real-Time Location Services
2 Months
EMI
0% Interest
Mode
Rank-Based Percentile Gui Calculator using Tkinter
Live Online / Offline

Let's take the first step to becoming an expert in Data Analytics

Click Here to Get Started

Lifelong Placement
Assistance

Get Certified

JOB PLACEMENT ELIGIBILITY TEST

×

Your Placement Eligibility Report

Want more details about Data Analytics?

Fill out the form, and our counsellors will get in touch with you at your preferred time. You can have all your queries answered. Once you decide that SLA is the perfect fit for your training needs, our counselors will guide you through the process every step of the way.

Course Schedules

Course Syllabus

Course Fees

CRM System Testing

or any other questions...

Fees, Duration & Batch Timings for Data Analytics

Hands On Training
3-5 Real Time Projects
60-100 Practical Assignments
3+ Assessments / Mock Interviews
July 2026
Week days
(Mon-Fri)
Online/Offline

2 Hours Real Time Interactive Technical Training 

1 Hour Aptitude 

1 Hour Communication & Soft Skills

(Suitable for Fresh Jobseekers / Non IT to IT transition)

Course Fee
July 2026
Week ends
(Sat-Sun)
Online/Offline

4 Hours Real Time Interactive Technical Training

(Suitable for working IT Professionals)

Course Fee

Save up to 20% in your Course Fee on our Job Seeker Course Series

Learn More

Syllabus of Data Analytics

Download Syllabus
  • Python Introduction & history
  • Color coding schemes
  • Salient features & flavors
  • Application types
  • Language components
  • String handling management
    • String operations – indexing, slicing, ranging
    • String methods – concatenation, repetition, formatting
    • Supporting functions
  • Native data types
    • List
    • Tuple
    • Set
    • Dictionary
  • Decision making statements
    • If
    • If…else
    • If…elif…else
  • Looping statements
    • For loop
    • While loop
  • Function types
    • Built-in functions
    • Math functions
    • User defined functions
    • Recursive functions
    • Lambda functions
  • OOPs
    • Classes and objects
    • init constructor
    • Self-keyword
    • Data abstraction
    • Data encapsulation
    • Polymorphism
    • Inheritance
  • Exception handling
    • Error vs exception
    • Types of error
    • User defined exception handling
    • Exception handler components
    • Try block, except block, finally block
  • Data Visualization
  • Reporting Business Intelligence (BI)
  • Traditional BI
  • Self-Serviced BI Cloud Based BI
  • On Premise BI
  • Power BI Products
  • Power BI Desktop (Power Query, Power Pivot, Power View)
  • Flow of Work in Power BI Desktop
  • Power BI Report Server
  • Power BI Service, Power BI Mobile
  • Power BI Architecture
  • A Brief History of Power BI
  • Data Transformation
  • Benefits of Data Transformation
  • Shape or Transform Data using Power Query
  • Overview of Power Query / Query Editor
  • Query Editor User Interface
  • The Ribbon (Home, Transform, Add Column, View Tabs)
  • The Queries Pane
  • The Data View / Results Pane
  • The Query Settings Pane, Formula
  • Bar Saving the Work
  • Data types
  • Changing the Data type of a Column Filters in Power Query
  • Auto Filter / Basic Filtering Filter a Column using
  • Text Filters Filter a Column using Number Filters
  • Filter a Column using Date Filters Filter Multiple Columns
  • Remove Columns / Remove Other Columns Name
  • Rename a Column Reorder Columns or Sort Columns
  • Add Column / Custom Column Split Columns Merge
  • Columns PIVOT, UNPIVOT Columns Transpose Columns
  • Header Row or Use First Row as Headers Keep Top Rows
  • Keep Bottom Rows Keep Range of Rows Keep Duplicates
  • Keep Errors Remove Top Rows
  • Remove Bottom Rows
  • Remove Alternative Rows
  • Remove Duplicates, Remove Blank Rows
  • Remove Errors Group Rows / Group By
  • IF..ELSE Conditions
  • TransformColumn()
  • RemoveColumns()
  • SplitColumns()
  • ReplaceValue()
  • Table.Distinct() Options and GROUP BY Options
  • Table.Group()
  • Table.Sort() with Type Conversions
  • PIVOT Operation and Table.Pivot ().
  • List Functions Using Parameters with M Language
  • Data Modeling Introduction Relationship
  • Need of Relationship Relationship Types
  • Cardinality in General
    • One-to-One
    • One-to-Many
    • Many-to-One
    • Many-to-Many
  • AutoDetect the relationship
  • Create a new relationship
  • Edit existing relationships
  • Make Relationship Active or Inactive
  • Delete a relationship
  • What is DAX
  • Calculated Column, Measures
  • DAX Table and Column Name Syntax
  • Creating Calculated Columns
  • Creating Measures
  • Calculated Columns Vs Measures
  • DAX Syntax & Operators
  • Types of Operators
    • Arithmetic Operators
    • Comparison Operators
    • Text Concatenation Operator
    • Logical Operators
  • Date and Time Functions
    • YEAR, MONTH,DAY
    • WEEKDAY, WEEKNUM FORMAT (Text Function)
    • Month Name, Weekday Name
    • IF
    • TRUE, FALSE NOT,
    • OR, IN, AND
  • Text Function
    • LEN, CONCATENATE
    • LEFT, RIGHT, MID UPPER
    • LOWER TRIM, SUBSTITUTE, BLANK
  • Logical Functions
    • IF TRUE, FALSE NOT
    • OR, IN, AND IF ERROR SWITCH
  • Math & Statistical Functions
    • INT ROUND, ROUNDUP
    • ROUNDDOWN
    • DIVIDE EVEN, ODD
    • POWER, SIGN SQRT
    • FACT SUM, SUMX MIN, MINX MAX
    • MAXX COUNT,
    • COUNTX AVERAGE
    • AVERAGEX COUNTROWS
    • COUNTBLANK
  • Report View User Interface
  • Fields Pane
  • Visualizations pane
  • Ribbon, Views, Pages Tab
  • Canvas Visual Interactions Interaction Type (Filter, Highlight, None)
  • Visual Interactions Default Behavior, Changing the Interaction
  • Grouping and Binning Introduction
  • Using grouping, Creating Groups on Text Columns
  • Using binning, Creating Bins on Number Column and Date Columns
  • Sorting Data in Visuals
  • Changing the Sort Column
  • Changing the Sort Order
  • Sort using column that is not used in the Visualization
  • Sort using the Sort by Column button
  • Hierarchy Introduction
  • Default Date Hierarchy
  • Creating Hierarchy
  • Creating Custom Date Hierarchy
  • REPORT VIEW
  • Change Hierarchy Levels
  • Drill-Up and Drill-Down Reports
  • Data Actions, Drill Down, Drill Up, Show Next Level
  • Expand Next Level Drilling filters other visuals option
  • Visualizing Data
  • Why Visualizations
  • Visualization types
  • Create and Format Bar and Column Charts
  • Create and Format Stacked Bar Chart
  • Stacked Column Chart
  • Create and Format Clustered Bar Chart
  • Clustered Column Chart
  • Create and Format 100% Stacked Bar Chart 100% Stacked Column Chart
  • Create and Format Pie and Donut Charts
  • Create and Format Scatter Charts
  • Create and Format Table Visual
  • Matrix Visualization
  • Line and Area Charts
  • Create and Format Line Chart, Area Chart
  • Stacked Area Chart Combo Charts
  • VISUALIZATIONS
  • Create and Format Line and Stacked Column Chart
  • Line and Clustered Column Chart
  • Create and Format Ribbon Chart
  • Waterfall Chart, Funnel Chart
  • Power BI Service Introduction
  • Power BI Cloud Architecture
  • Creating Power BI Service Account
  • SIGN IN to Power BI Service Account
  • Publishing Reports to the Power BI service
  • Import / Getting the Report to PBI Service
  • My Workspace / App Workspaces Tabs
  • DATASETS, WORKBOOKS, REPORTS & DASHBOARDS
  • Working with Datasets Creating Reports in Cloud using Published
  • Datasets
  • Creating Dashboards Pin Visuals and Pin LIVE
  • Report Pages to Dashboard
  • Advantages of Dashboards Interacting with
  • Dashboards
  • Formatting Dashboard, Sharing Dashboard
  • Group by()
  • Pivot tables()
  • Multi-indexing()
  • merge()
  • concatenate()
  • join()
  • data transformation using apply()
  • map()
  • query()
  • Resampling time series functionality
  • excel writer()
  • pipe()
  • creating dataframes
  • reading CSV files with intrinsic index
  • converting CSV files to dataframes
  • converting dataframes to CSV files
  • converting dataframes to excel file
  • Common Table Expressions (CTE)
  • Recursive CTE’s
  • temporary functions
  • pivoting data with sum() and CASE WHEN
  • Except vs Not in
  • self joins, rank vs dense_rank vs row number
  • ranking data
  • calculating delta values,
  • multiple groupings using rollup
  • calculating running totals
  • computing a moving average
  • date time manipulations
  • Formatting strings, stored methods
  • JOINS
  • Sub Queries
  • Manipulation of date and time
  • procedural data storage
  • Connecting SQL to Python or R language, window Functions
  • Project1 – Product Sales Analysis – Power BI Project and review
  • Project2 – Financial Performance Analysis – Power BI Project and review
  • Project3 – Health care sales Analysis –
  • Intermediate Power BI project and review
  • Project4 – Anamoly detection in Credit card transactions – Intermediate Power BI project and review

Objectives of Data Analytics

The following are the learning outcomes of the Data Analytics Online Course:

  • Learn to gather, clean, process, and transform data
  • Employ the proper analytic models and evaluate the quality of the input.
  • Conclude the data, and look into possible problems. 
  • Utilize optimization concepts and mathematical and statistical models to build and utilize data analysis.
  • Utilize computing theory, languages, and algorithms for data analytics.
  • Create and apply suitable data analysis models to uncover answers for business-related problems.
  • Effectively communicate data insights to any audience through textual, graphic, and oral media. 
Request a Free Callback

Why Softlogic Systems is the Best Choice for Data Analytics – Learn, Practice, and Get Placed!

Crowdfunding Platform
Online & Offline Training Options
Learn at your convenience with flexible classroom and live online training.
Learn from 100+ Real-Time Developers
Get trained by industry professionals with years of hands-on experience.
Voting System with Python Django
Hands-on Projects & Codeathons
Practice with real-time projects and coding challenges to build confidence.
0% EMI Fee Options
Pay your course fees flexibly with easy EMI plans at zero interest.
Resume & Interview Support
Get expert help with resume building, mock interviews, and soft skills.
Placement with Top IT Firms
Access placement opportunities with leading MNCs and IT companies.
1000+ Hiring Partners
Benefit from Softlogic’s strong recruiter network for faster job placement.
No Backdoor Jobs
We ensure only genuine placement opportunities with trusted companies.
Request a Free Callback

Highlights of Data Analytics

Raw data is transformed into useful insights through data analytics. Data-driven issue-solving and trend identification are achieved through the utilization of various tools, technologies, and processes. Learn more about it in our Data Analytics Online Training.

Here are the reasons to choose data analytics for your career:

  • Using data analytics in your decision-making
  • Mastering data analytics enhances your ability to solve problems.
  • Careers in data analytics are very lucrative.
  • Careers in data analytics offer a wide range of job opportunities and potential for advancement.
  • Jobs in data analytics are in great demand.
  • Skills in data analytics are useful in daily life.

You’ll learn the fundamentals quickly with our introductory-level data analytics course. To learn the Data Analytics Online Course, there are no strict prerequisites. However, a fundamental understanding of programming languages and statistics will help you learn our data analytics online course efficiently.

Our Online Data Analytics Course is suitable for:

  • Students/Freshers
  • Working professionals seeking a career transformation
  • Any Job seeker with a computer science degree

Our data analytics online training costs could differ based on the course level and program mode. The approximate online Data Analytics course fee is approximately ₹45,000 for the duration of 3 months, which includes international certification. Contact our learning managers for offers, discounts, and EMI options for Data Analytics Online Course Fees

Some jobs that can be applied for after our Data Analytics online course are:

  • Business Analyst; 
  • Data Analyst
  • Analyst for Market Research
  • Analyst of Business Intelligence
  • Analyst for Marketing
  • Social media analyst and web analyst

With less than 2 years of experience, the average Data Analyst’s freshers salary is from 3 to 5 lakhs per year. The average yearly salary for mid-career data analysts with 3 years of experience is approximately ₹6 lakh. An experienced data analyst with over 5 years of experience should expect to make approximately ₹8.3 lakhs per year on average.

Here are some real-time applications in the data analytics field:

  • E-commerce sites
  • Apps for traffic navigation
  • streaming services
  • Systems for Emergency Response
  • Medical Monitoring Devices 
  • Systems for managing energy 

Boost Your Skills with Our Data Analytics Experts

Our Mentors are from Top Companies like:
  • Our trainers in data analytics are highly skilled experts in the subject, possessing extensive technical knowledge and proficiency.
  • Their expertise in overseeing and executing data-driven solutions is extensive.
  • They develop thorough study guides to assist students in grasping the foundations of data analytics and the opportunities present in many analytical fields.
  • Our trainers teach students the fundamentals of big data, machine learning techniques, data exploration, and data visualization. They are well-versed in data analytics certification.
  • They teach using real-life scenario-based learning and mentorship, and they are quite skilled at getting the students ready for the certification tests. 
  • To guarantee that students receive training and learning that is successful, our trainers have excellent interpersonal and communication abilities.
  • They can set up servers for high-performance computing and provide robust and safe data solutions.
  • They can also use the software development life cycle to create and implement apps.
  • To help students develop their analytics skills, data analytics trainers evaluate their performance using analytics platforms and methodologies and offer comments.
  • The trainers are passionate about helping students obtain the necessary skills to land their ideal employment and approach the task with a team mentality.
Request a Free Callback

What Modes of Training are available for Data Analytics?

Offline / Classroom Training

A Personalized Learning Experience with Direct Trainer Engagement!
  • Direct Interaction with the Trainer
  • Clarify doubts then and there
  • Airconditioned Premium Classrooms and Lab with all amenities
  • Codeathon Practices
  • Direct Aptitude Training
  • Live Interview Skills Training
  • Direct Panel Mock Interviews
  • Campus Drives
  • 100% Placement Support
Explore Offline Courses

Online Training

Interactive Quiz Website
Instructor Led Live Training! Learn at the comfort of your home
  • No Recorded Sessions
  • Live Virtual Interaction with the Trainer
  • Clarify doubts then and there virtually
  • Live Virtual Interview Skills Training
  • Live Virtual Aptitude Training
  • Online Panel Mock Interviews
  • 100% Placement Support
Explore Online Courses

Corporate Training

Blended Delivery model (both Online and Offline as per Clients’ requirement)
  • Industry endorsed Skilled Faculties
  • Flexible Pricing Options
  • Customized Syllabus
  • 12X6 Assistance and Support
Explore Offline Courses
GET Free Consultation

Certifications

Take your career to new heights with Softlogic's software training certifications.
Improve your abilities to get access to rewarding possibilities
Earn Your Certificate of Completion
Validate your achievements with Softlogic's Certificate of Completion, verifying successful fulfillment of all essential components.
Take Your Career to the Next Level with  Certifications
Get a certifications through our training programs to gain a competitive edge in the industry.
Stand Out from the Crowd with Codethon Certificate
Verify the authenticity of your real-time projects with Softlogic's Codethon certificate.

Hands-on Project Practices in Data Analytics

Cost Analysis
Market basket analysis
Exploratory data analysis
Data and information visualization
Data cleansing
Recommendation System
Customer Churn Prediction
Sentiment Analysis
Credit card fraud detection

The SLA Way to Get Placed in Top IT Companies

Enrollment

Technology Training

Coding Practices
Realtime Projects

Placement Training

Aptitude Training
Interview Skills
CRM System Testing

Panel Mock
Interview

Unlimited
Interviews

Interview
Feedback

100%
IT Career

Placement Support for a Data Analytics Job

Genuine Placements. No Backdoor Jobs at Softlogic Systems.

Aptitude Training
from Day 1

CRM System Testing

Interview Skills
from Day 1

Softskills Training
from Day 1

Build Your Resume

Build your LinkedIn Profile

Build your GitHub
digital portfolio

Panel Mock Interview

Unlimited Interviews until you get placed

Life Long Placement Support at no cost

Request a Free Callback

FAQs

Data is made sense of by individuals and organizations with the use of data analytics. Usually, data analysts examine unprocessed data to find patterns and insights. They assist firms in making decisions and succeeding by utilizing a variety of tools and strategies. To learn more, enroll in our data analytics online course.

All businesses have a high demand for data analysts, and those who wish to advance in their careers have many options. Data analysts are needed by many elite organizations to help them leverage their data more effectively or to give them the right insights to support their business operations.

Although working with IT tools and systems is necessary, a data analyst position is not always an IT (information technology) job.

Yes. A profession as a data analyst is highly recommended for 2024 and beyond. Data analysts assist businesses in making decisions in the modern environment, where they mainly rely on data.  

Although coding is not usually necessary for employment in data analysis, some data analysts do have to do it daily. Join our data analytics online training for a promising career. 

Indeed, as long as businesses in all sectors of the economy continue to base their decisions on data, there will undoubtedly be a greater need for data analysts. Data is becoming more and more relevant, which is further supported by its complexity.

To become a fully qualified data analyst, you must acquire a wide range of skills. It might be very challenging as a result. On the other hand, you will find a wealth of useful resources to assist you during your journey. Furthermore, learning new things usually gets simpler the more you do it. 

Yes, we help our students get into various jobs through our data analytics online course. To assist you in beginning your job search, we offer extra tools like recruiting drives, practice interviews, and interview preparation classes in our data analytics online training institute.

SLA is located in two places to learn in person: K.K. Nagar and, Navalur along with the Data Analytics online course.

Typically, our Data Analytics online course consists of lectures, case studies, assignments, project practices, and help with job placement.

Additional Information for
the Data Analytics

Here are the top-notch data analytics trends

  • AI-Powered Data Analytics
  • Data-Centric AI
  • Metadata-driven Data Fabric
  • Edge Computing
  • Augmented Analytics
  • Natural Language Processing
  • To obtain data scientist jobs, the following skills are required:
    • Advanced programming skills
    • Advanced mathematics knowledge
    • Understanding of machine learning
  • To obtain jobs in a management role, you have to focus on developing your leadership skills
  • Below are specialized jobs that also can be applied after our data analytics online course:
    • Business Analysts
    • Financial Analysts
    • Operation Analysts
    • Marketing Analysts
    • System Analysts
    • Healthcare Analysts
    • Data Science Consultant

Enroll in our Data Analytics Online Certification Course

Related Blogs

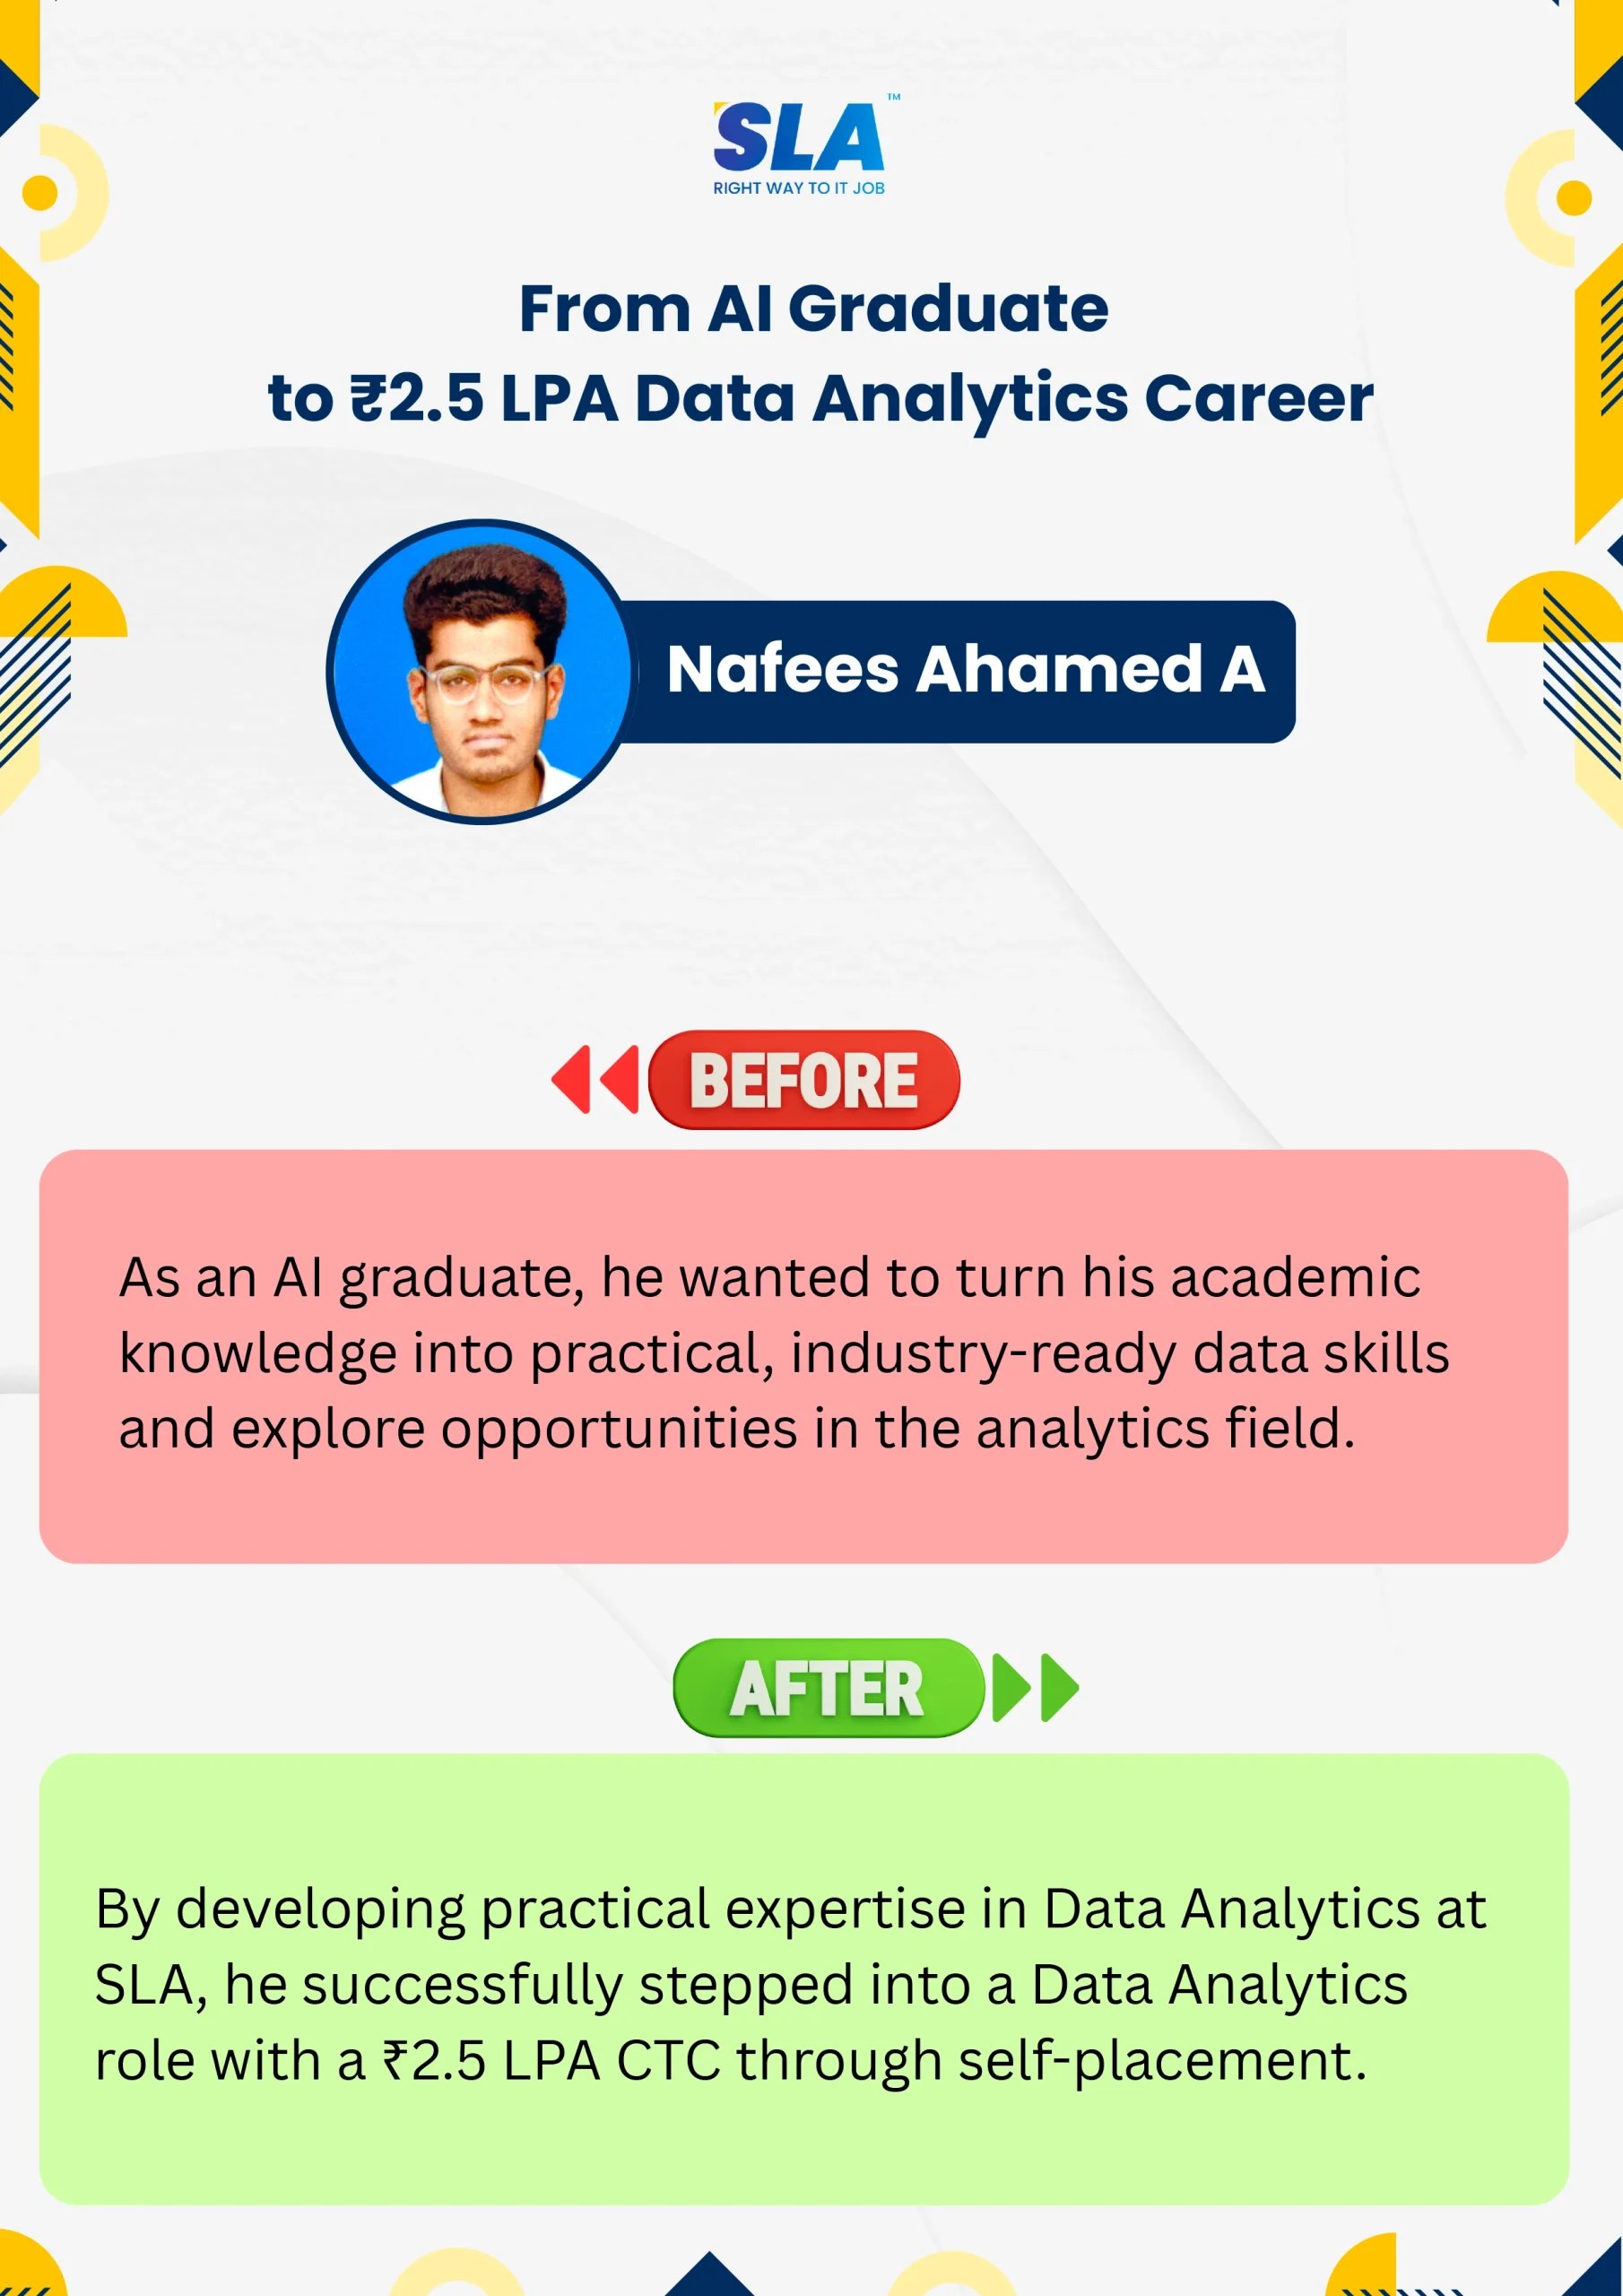
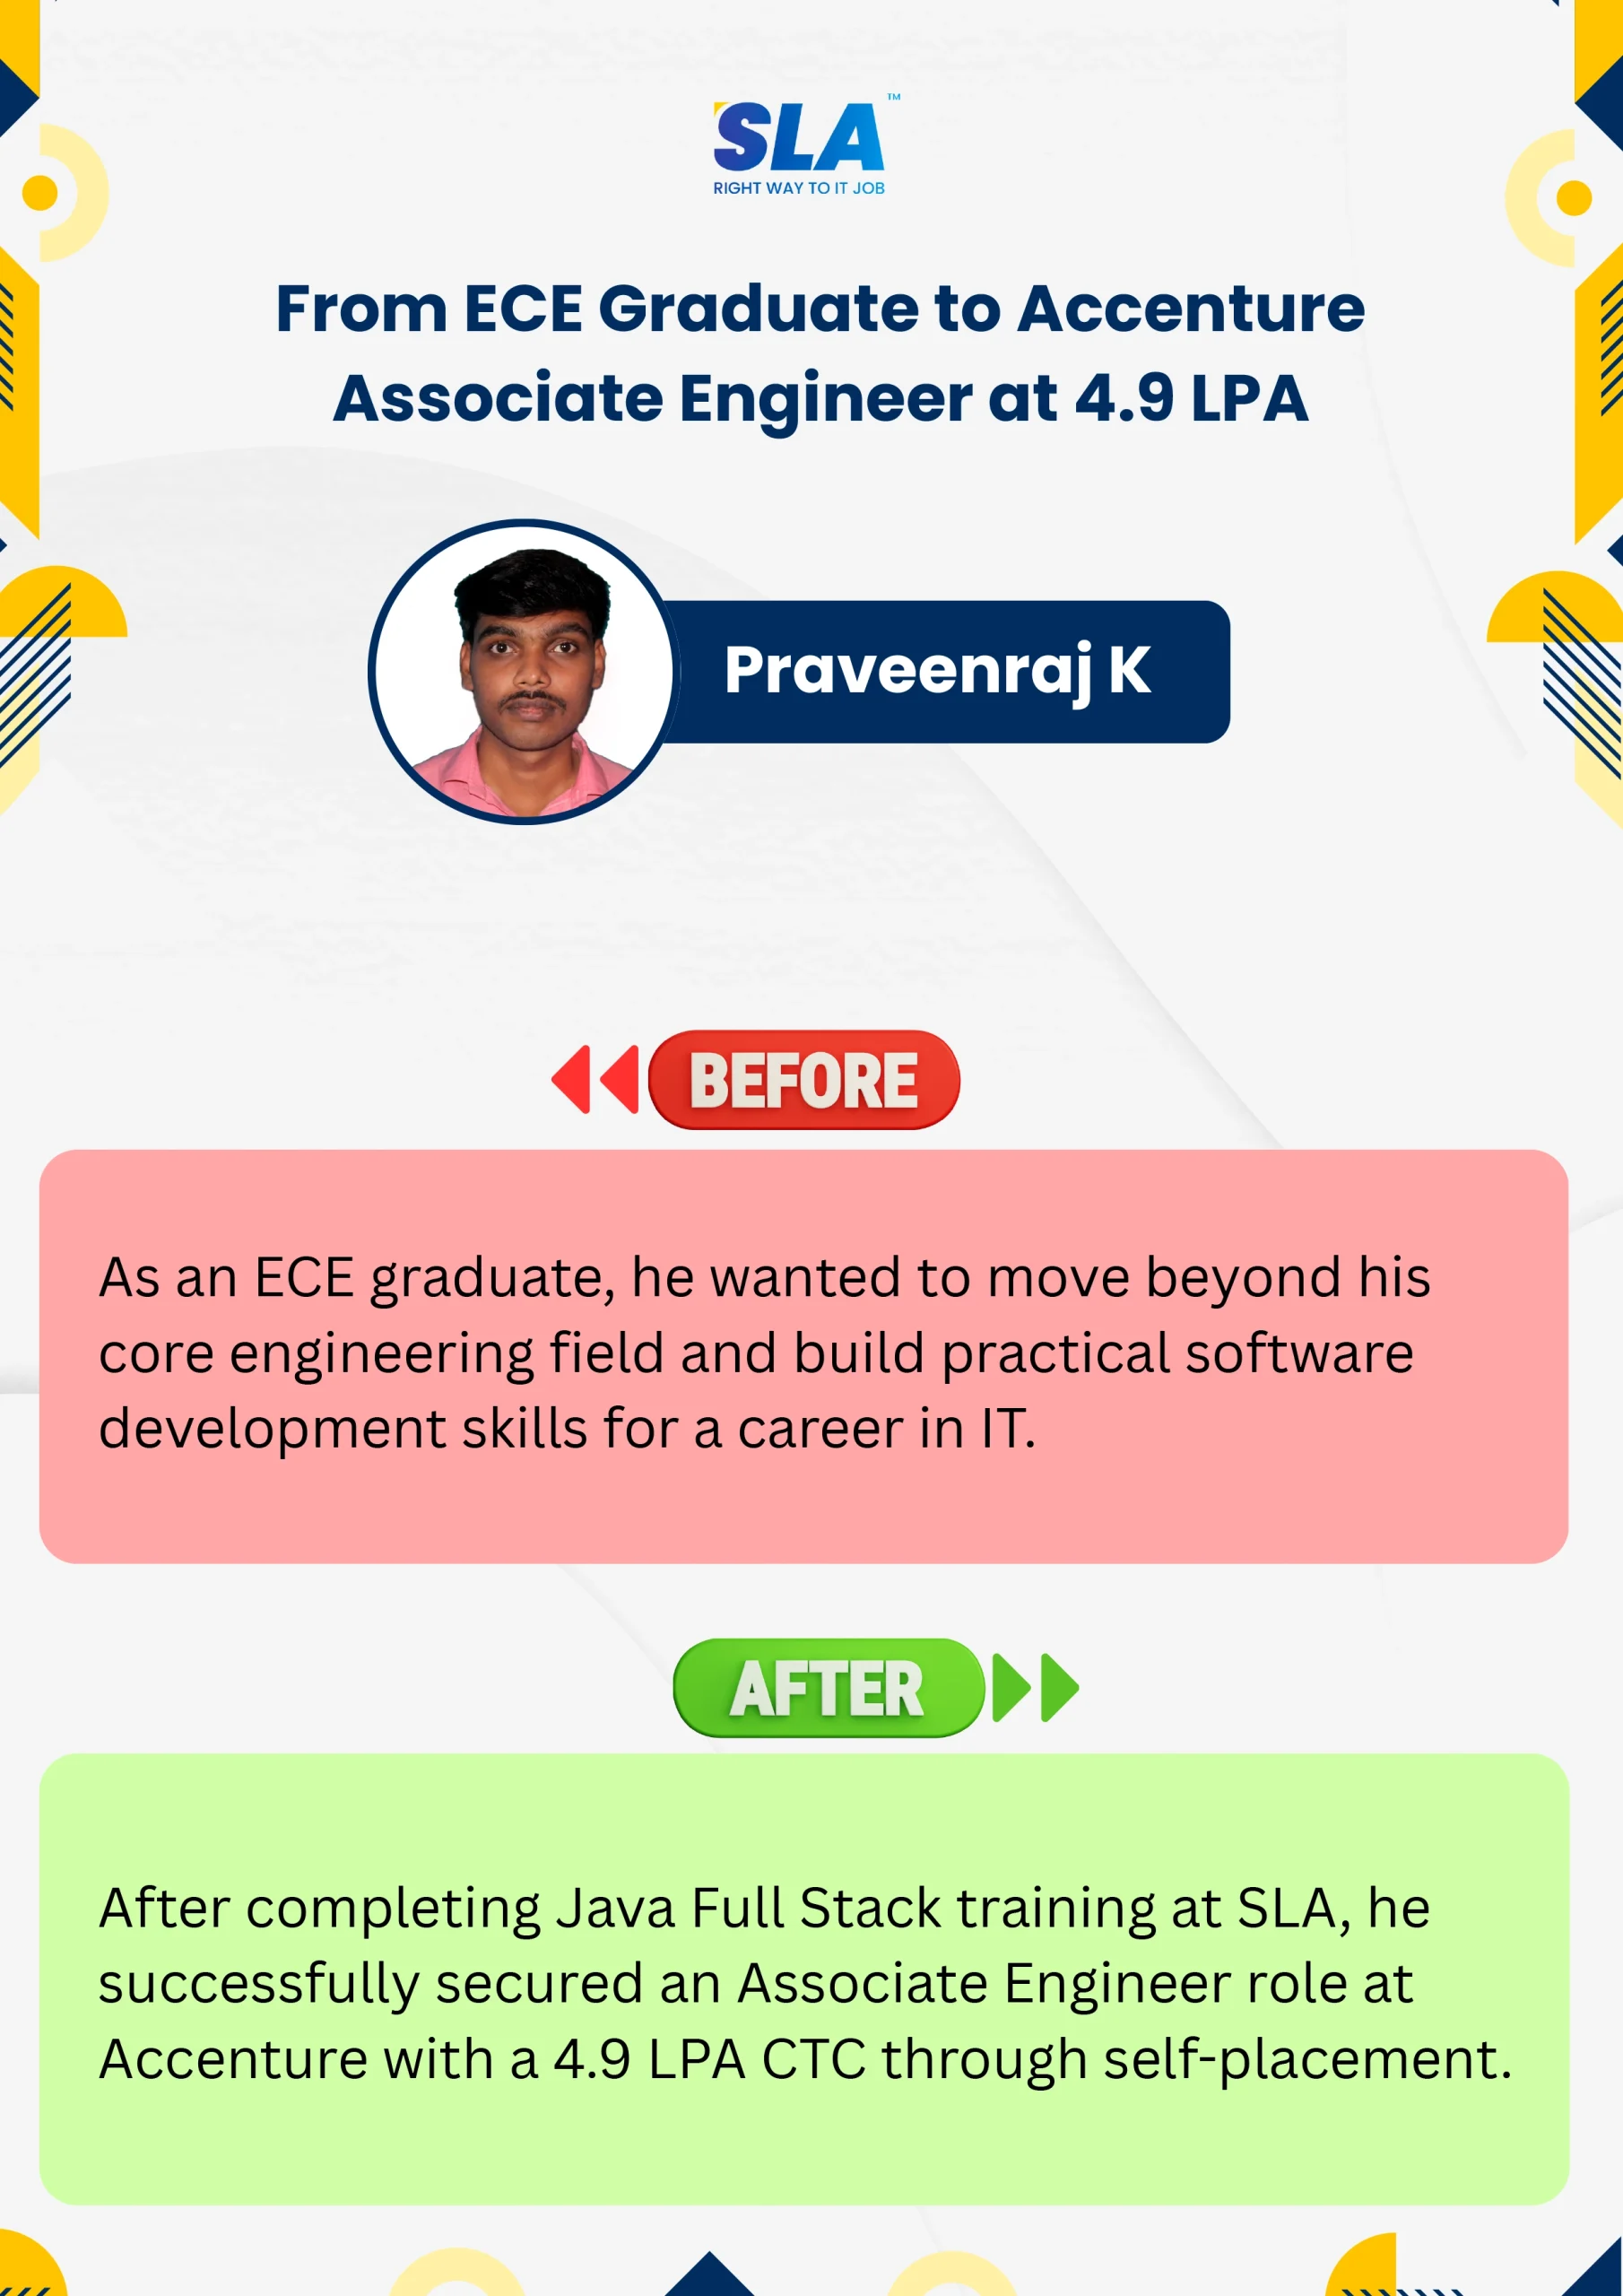
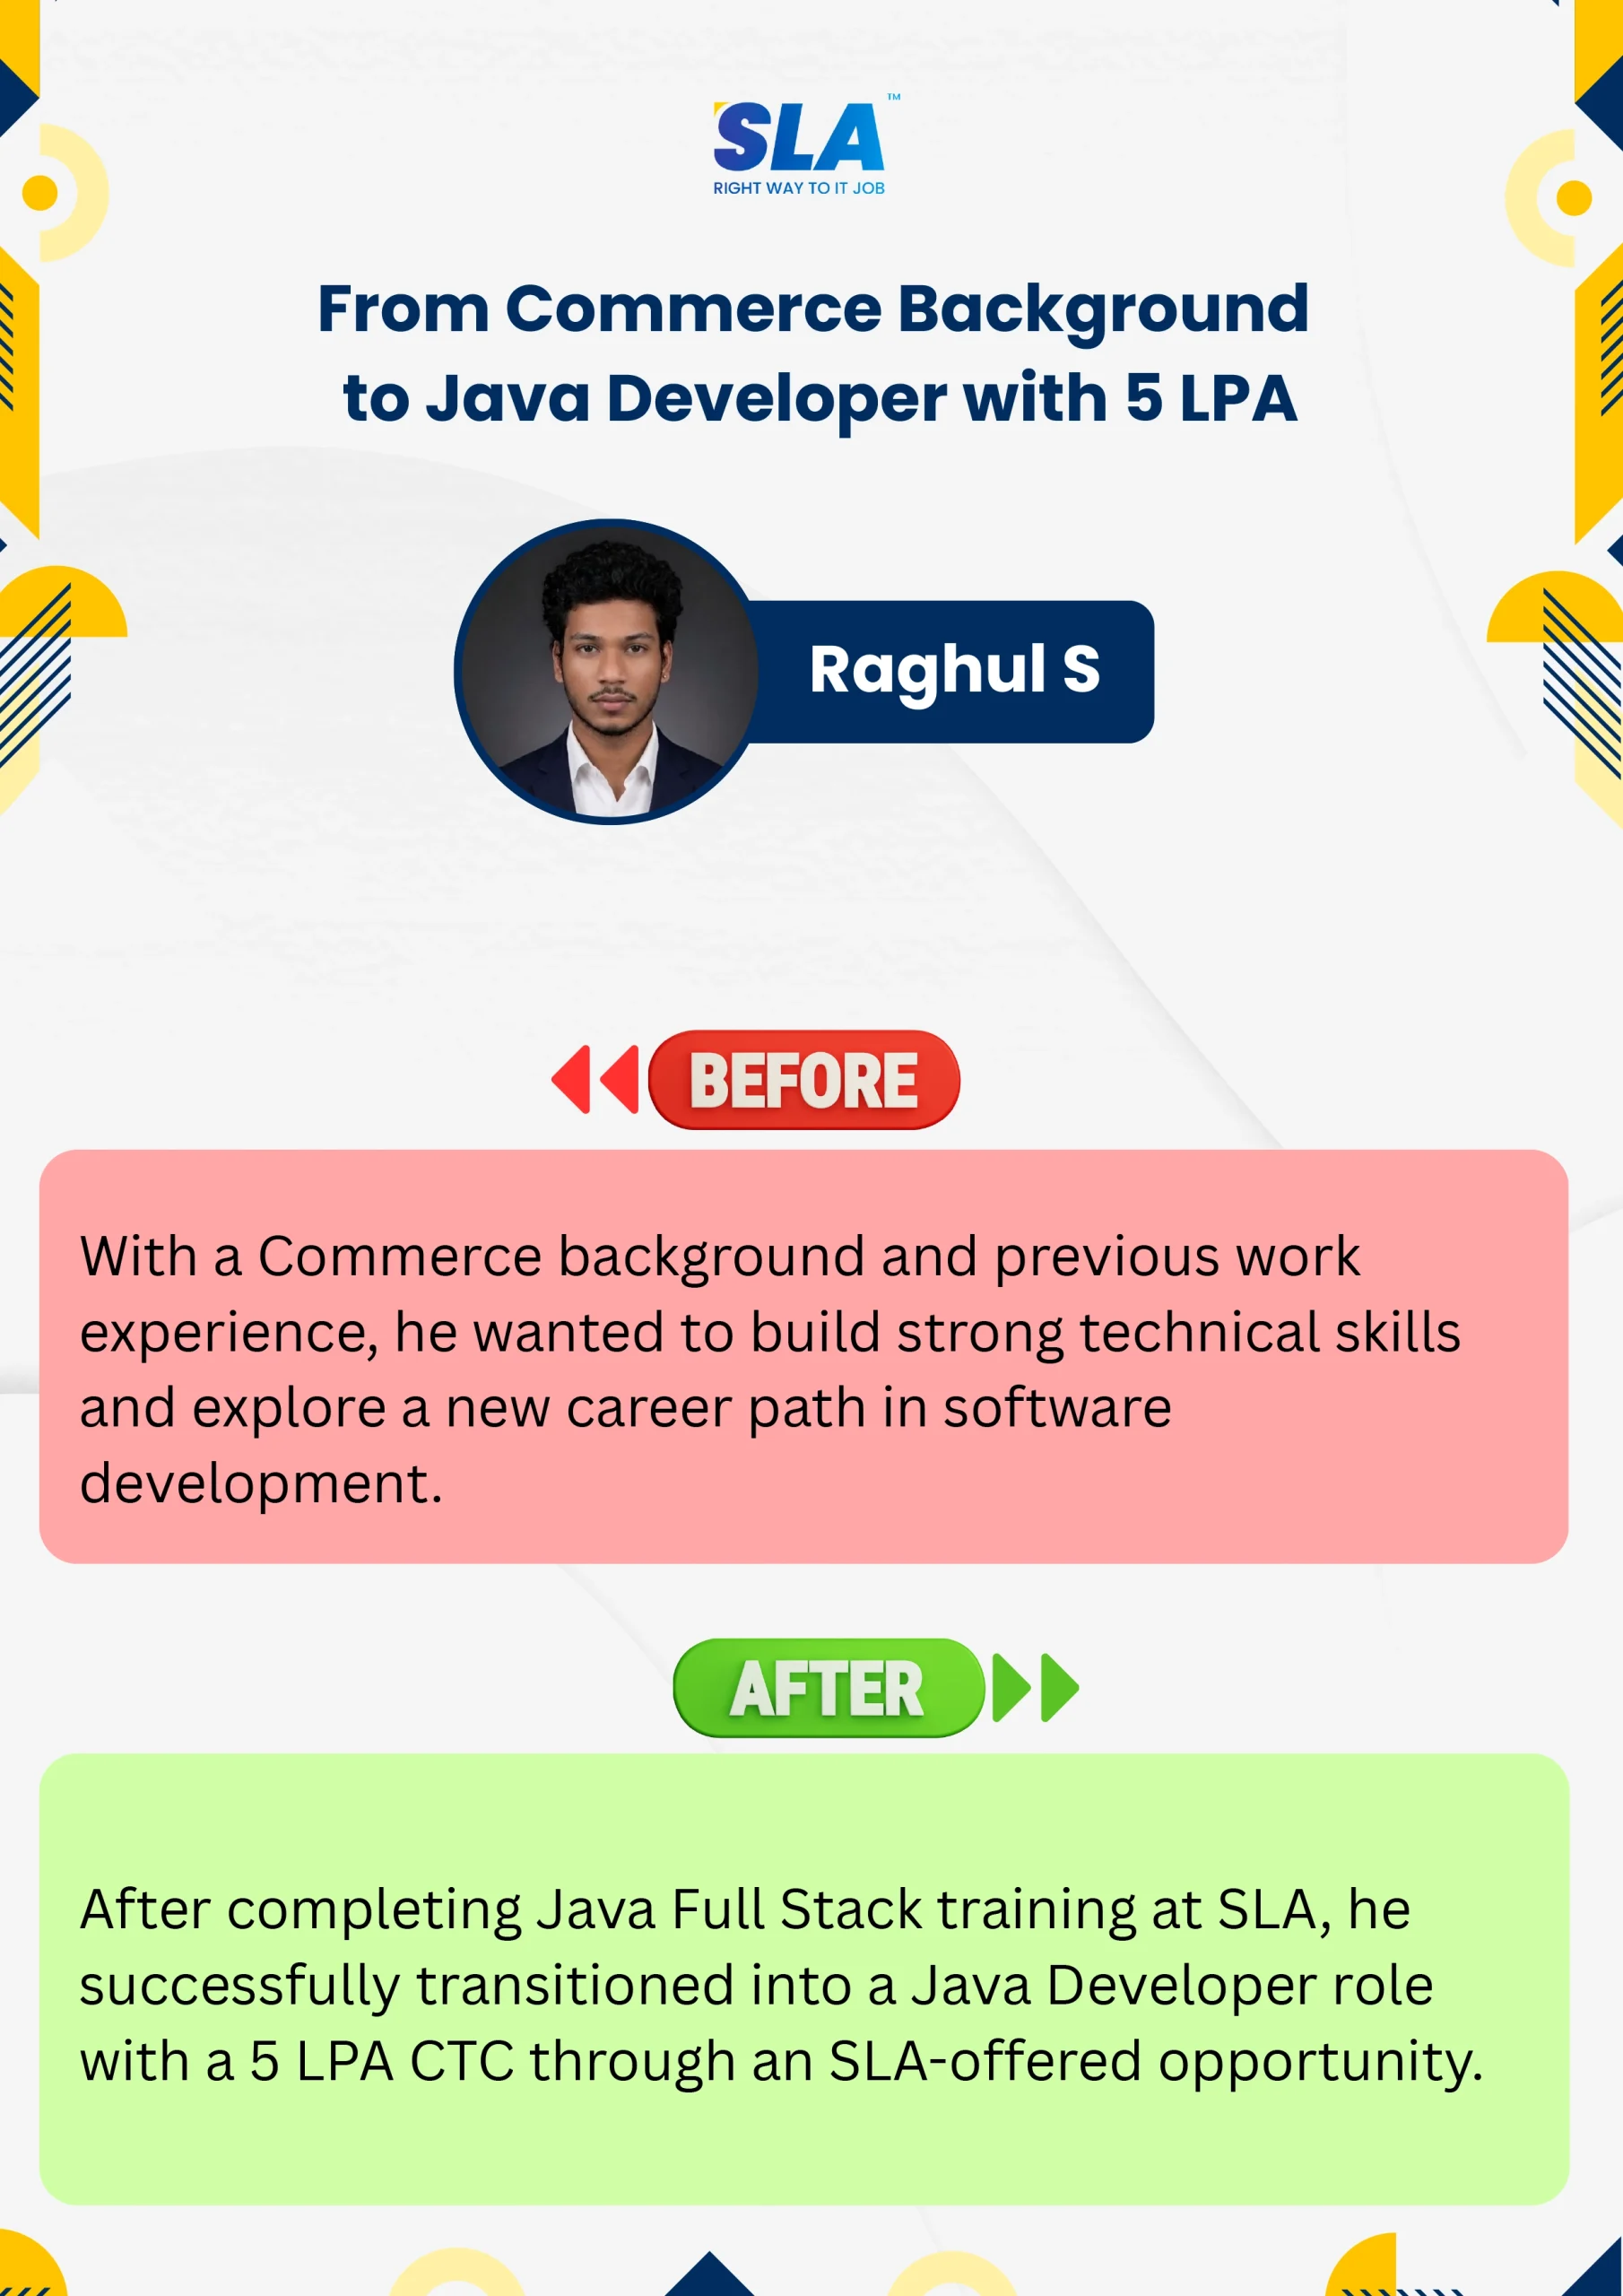
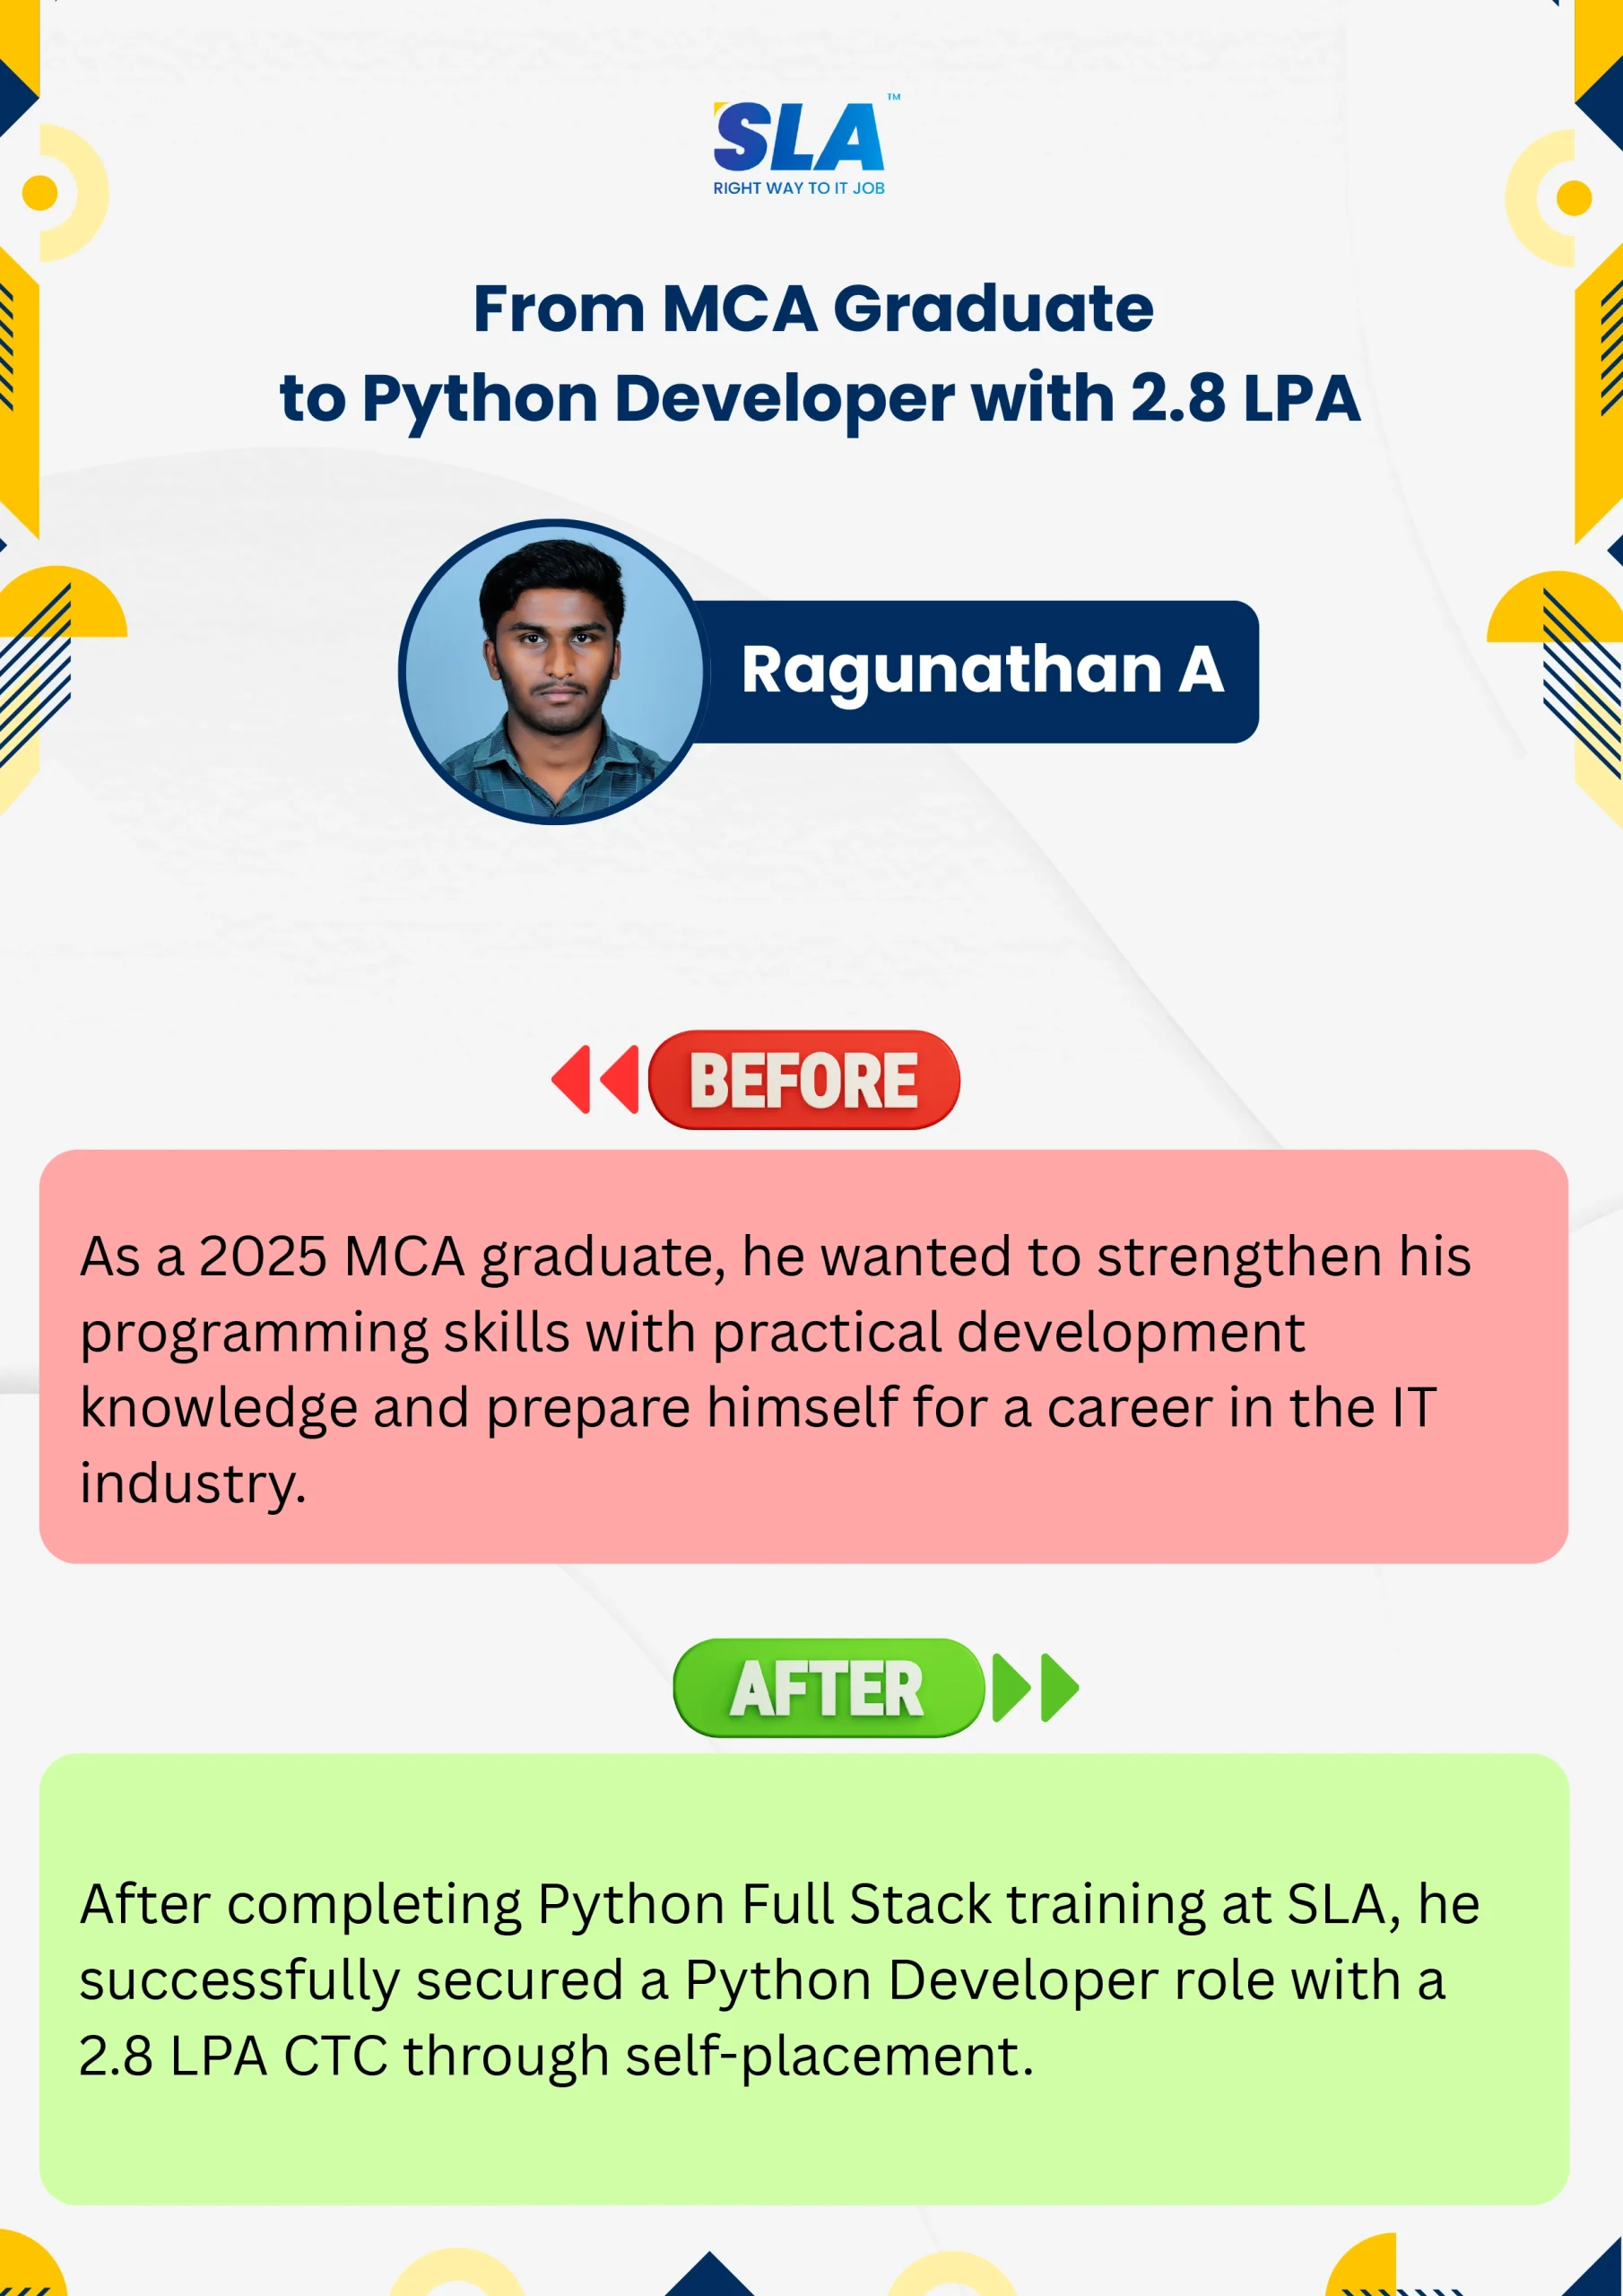
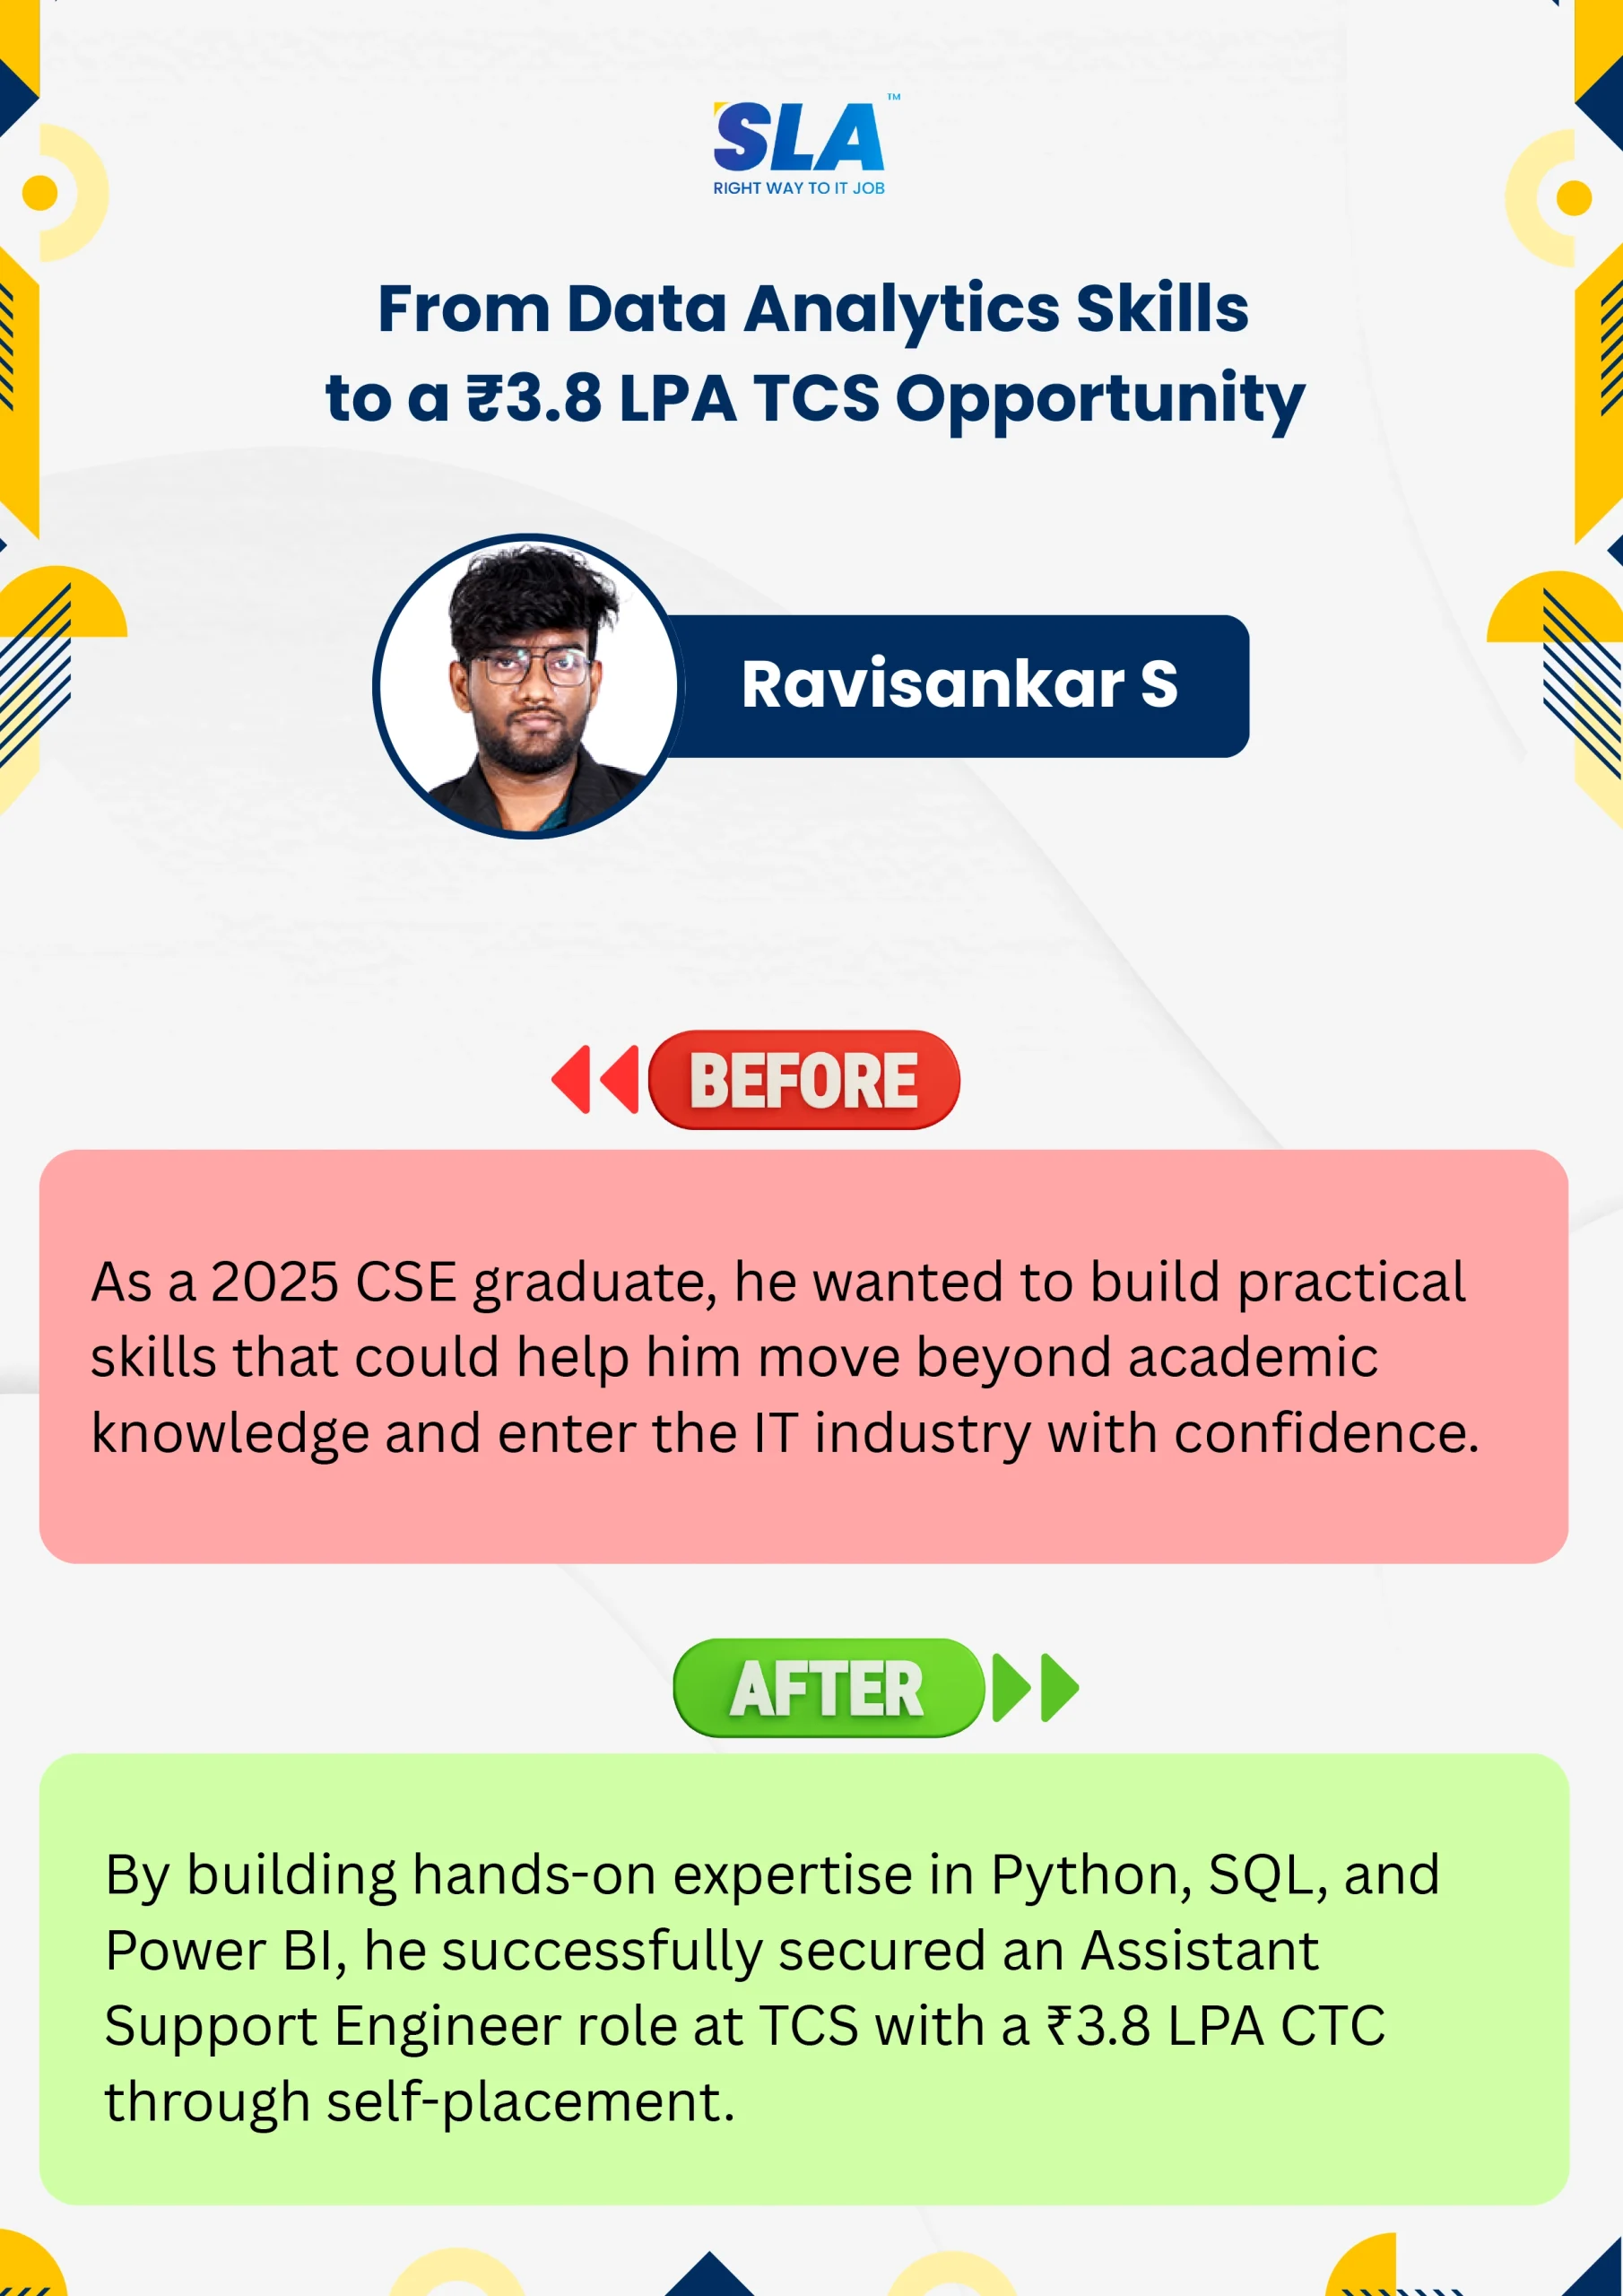
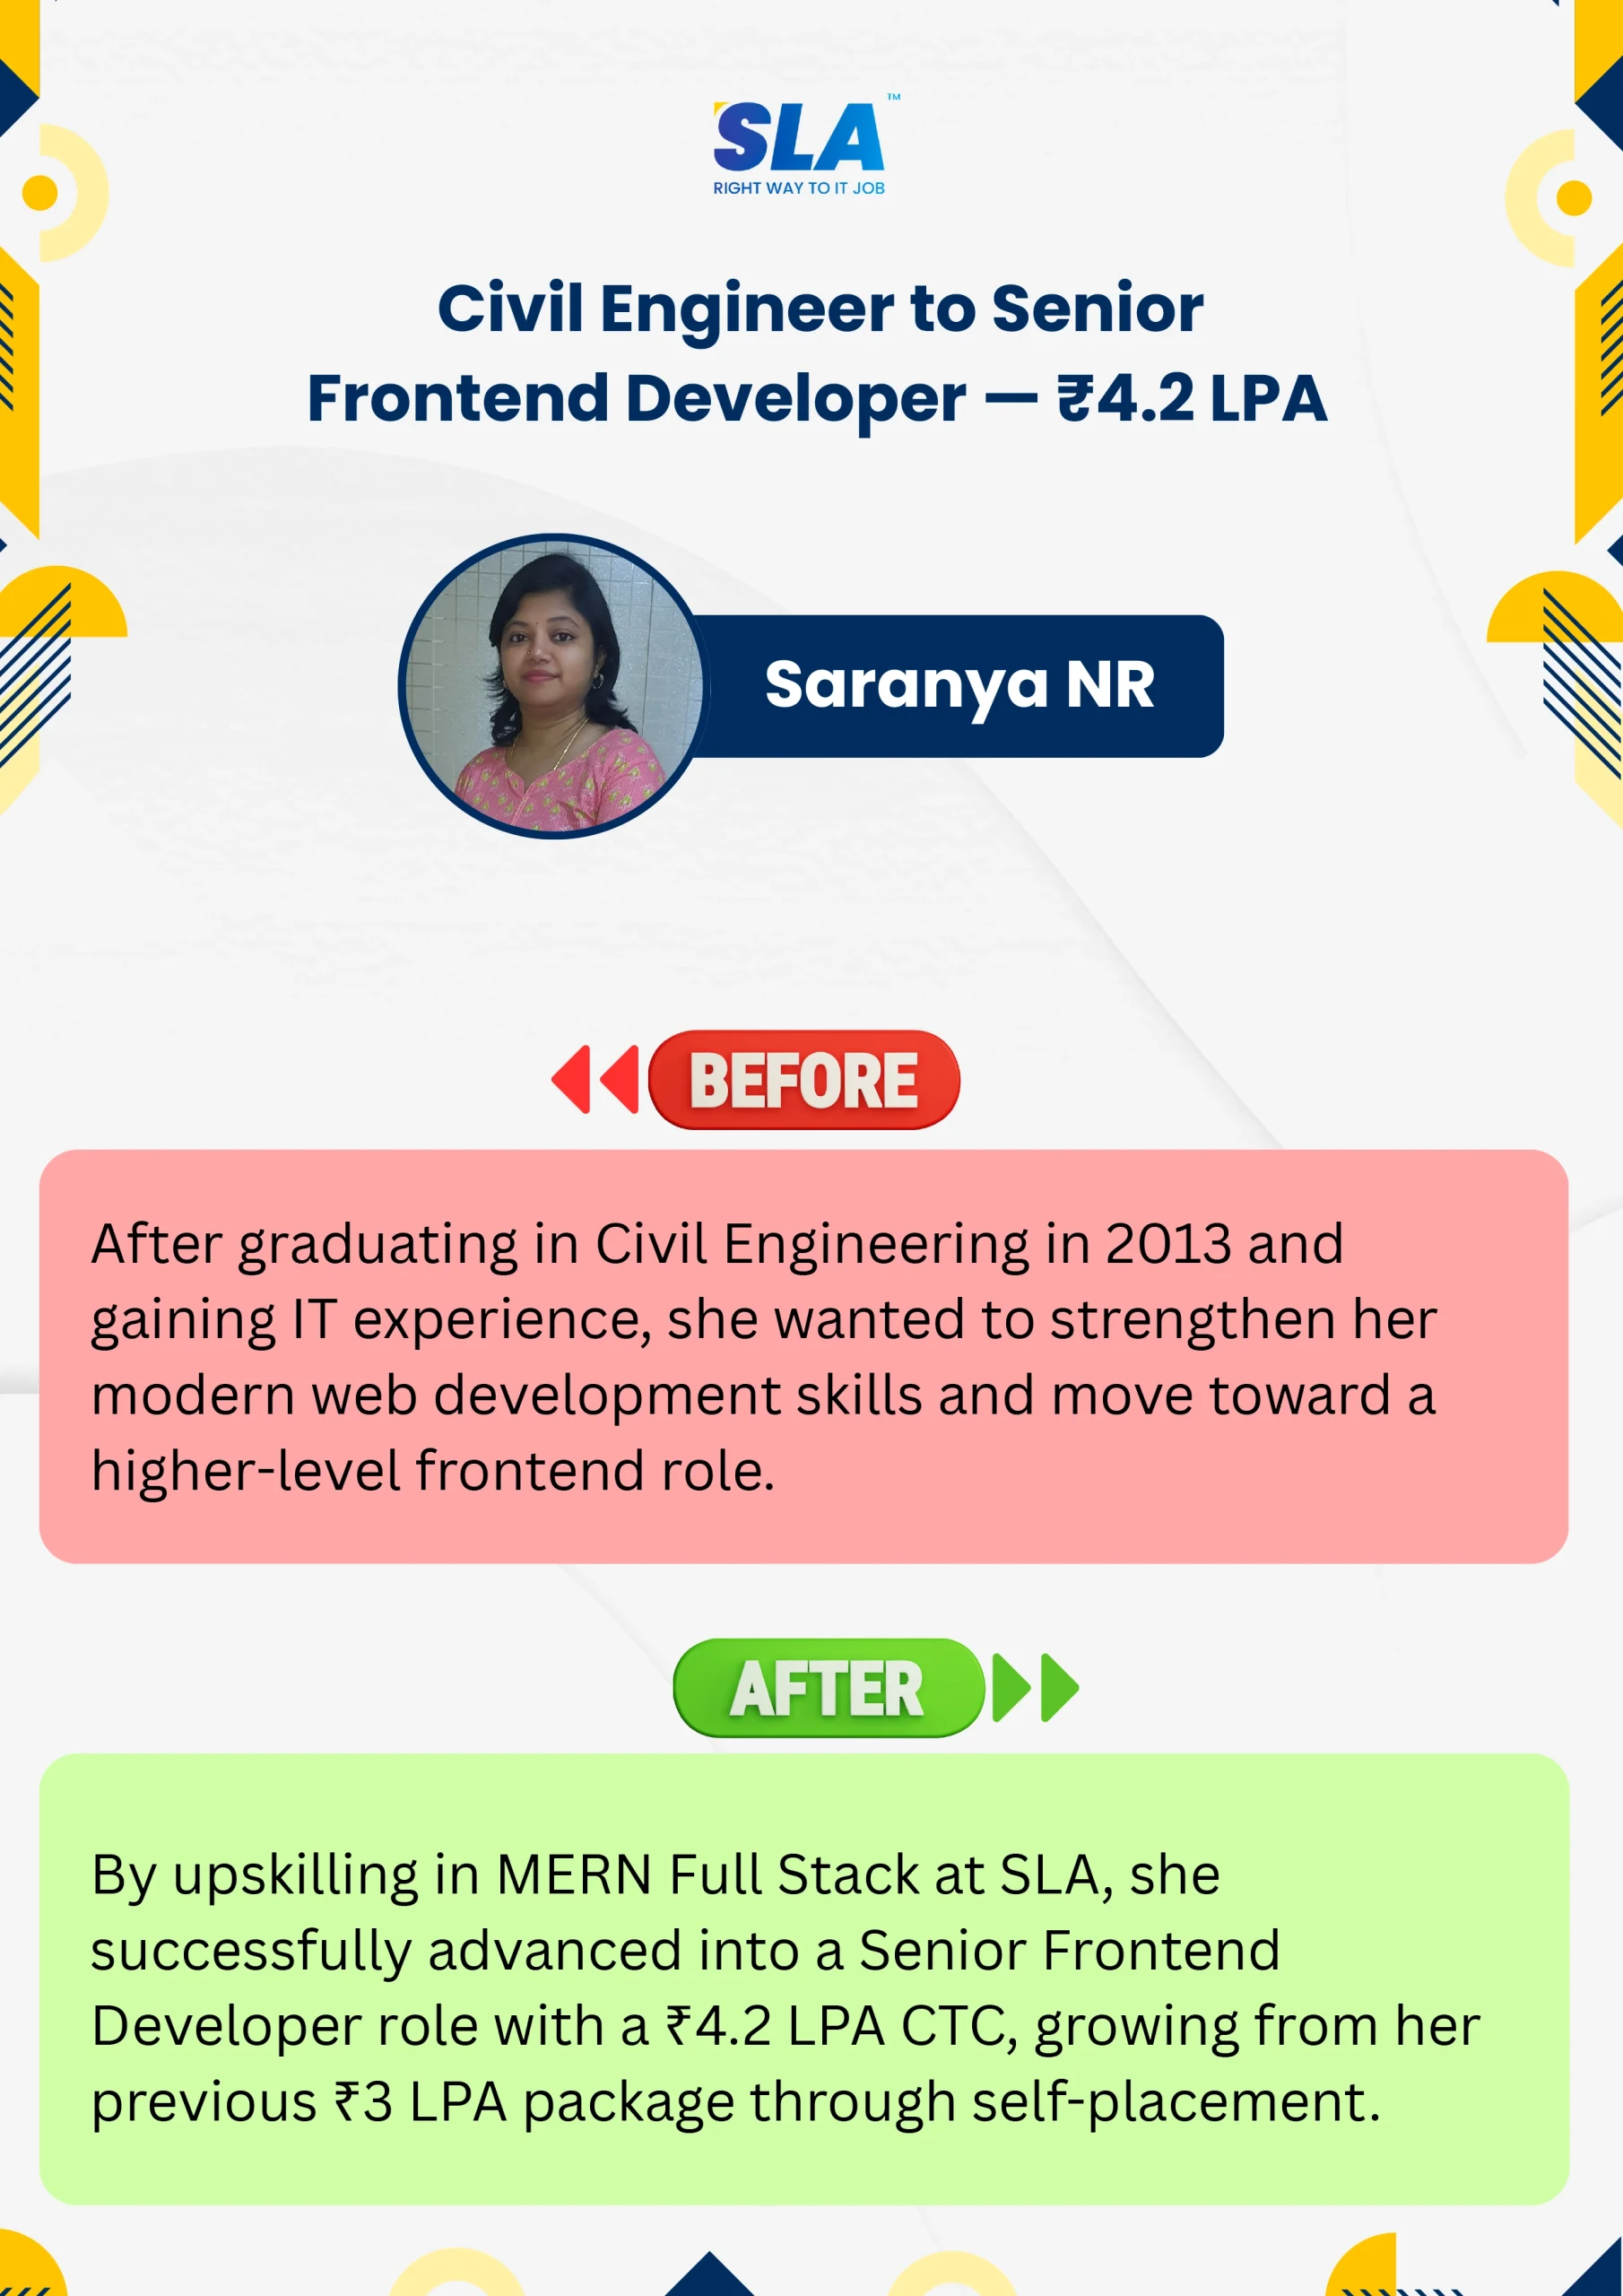
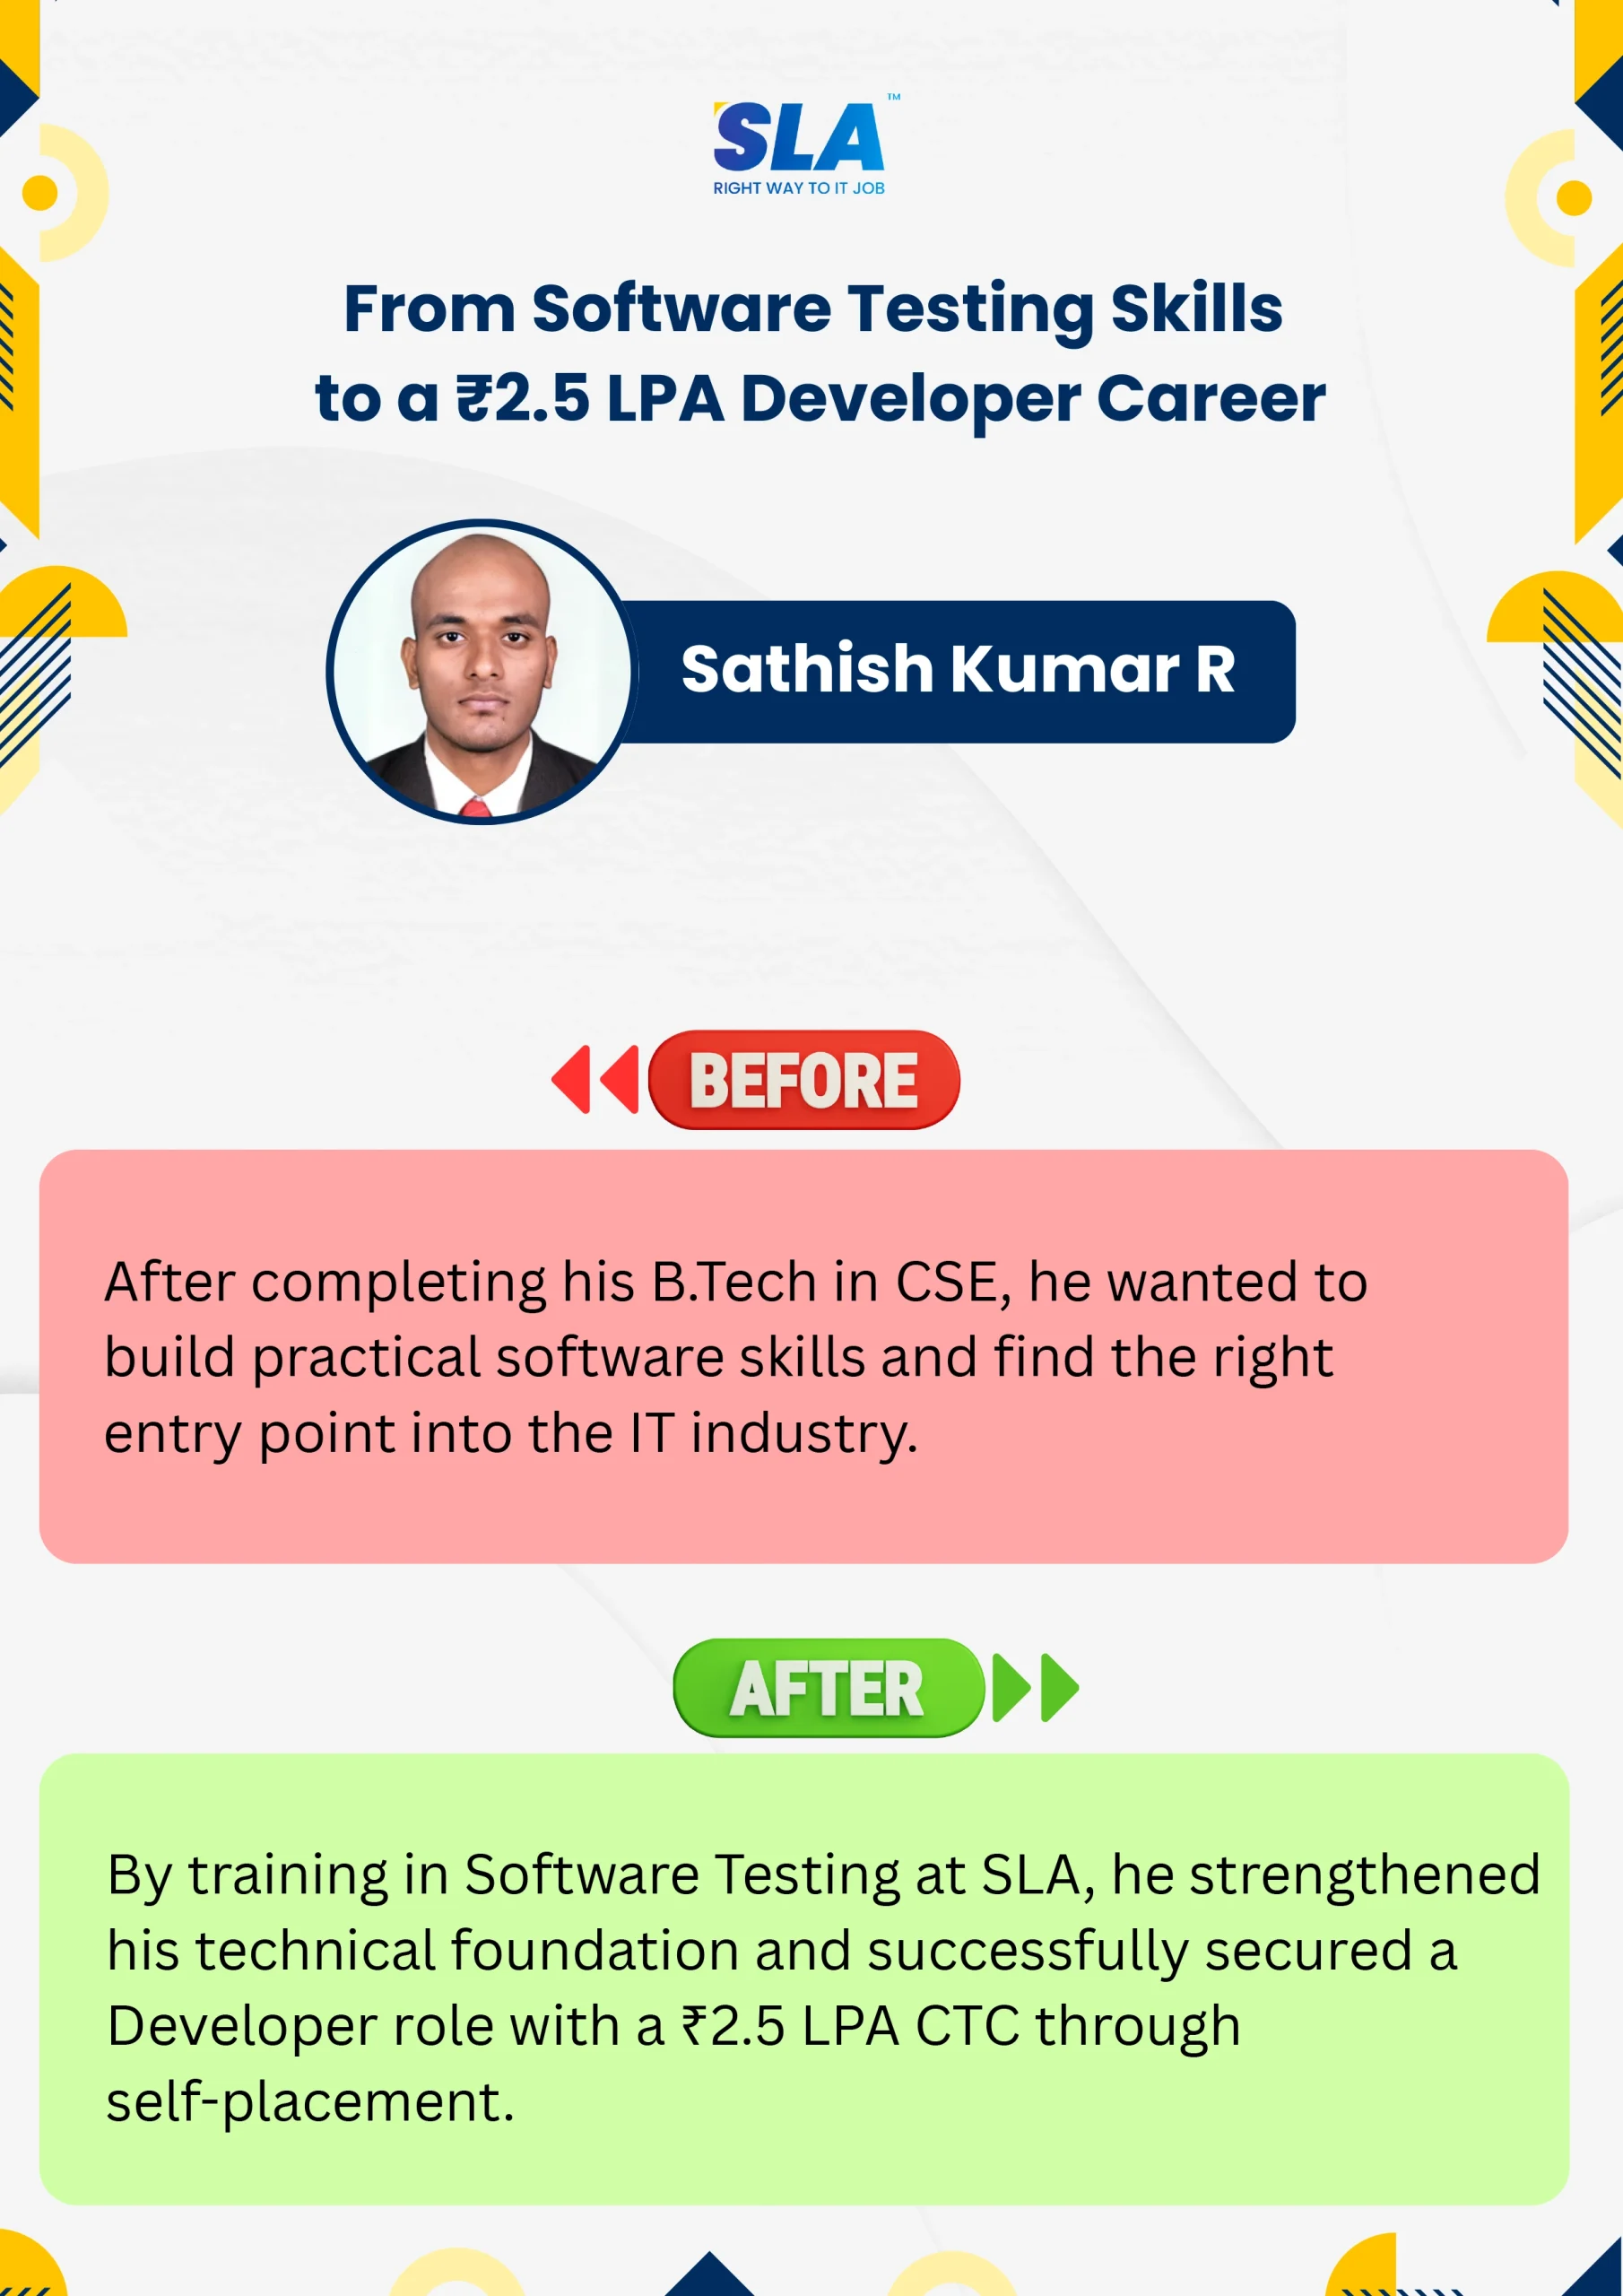
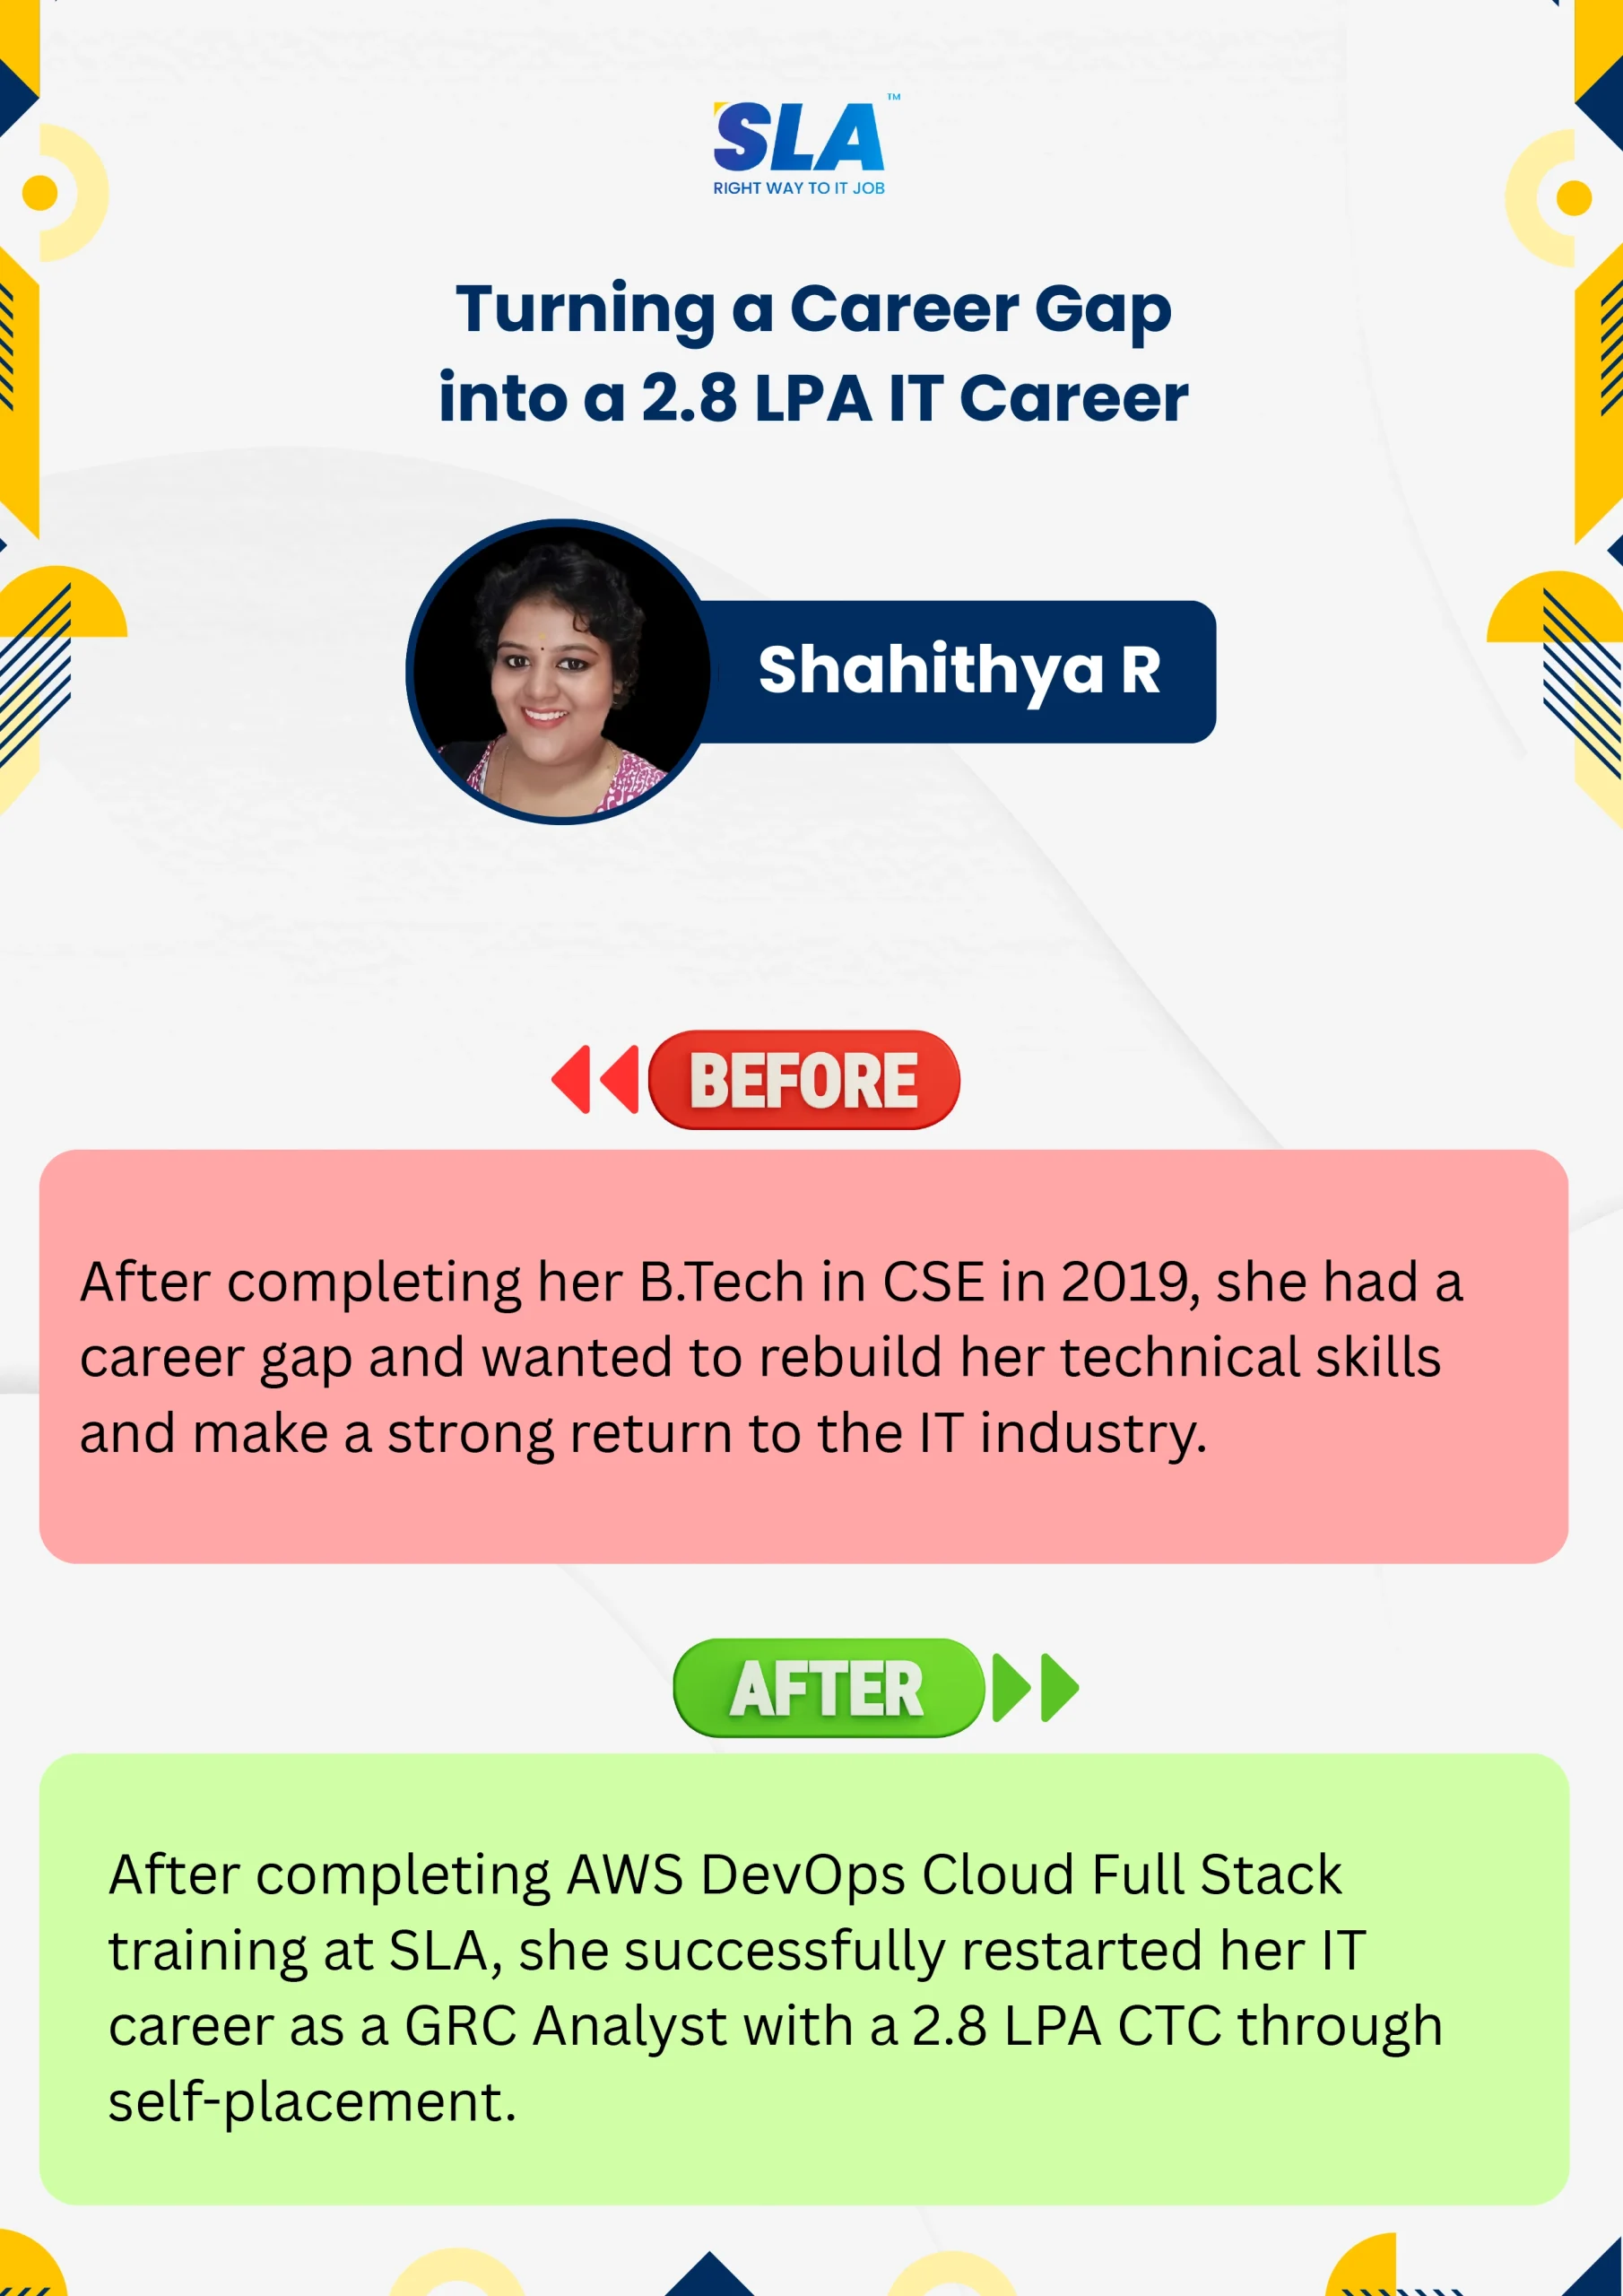
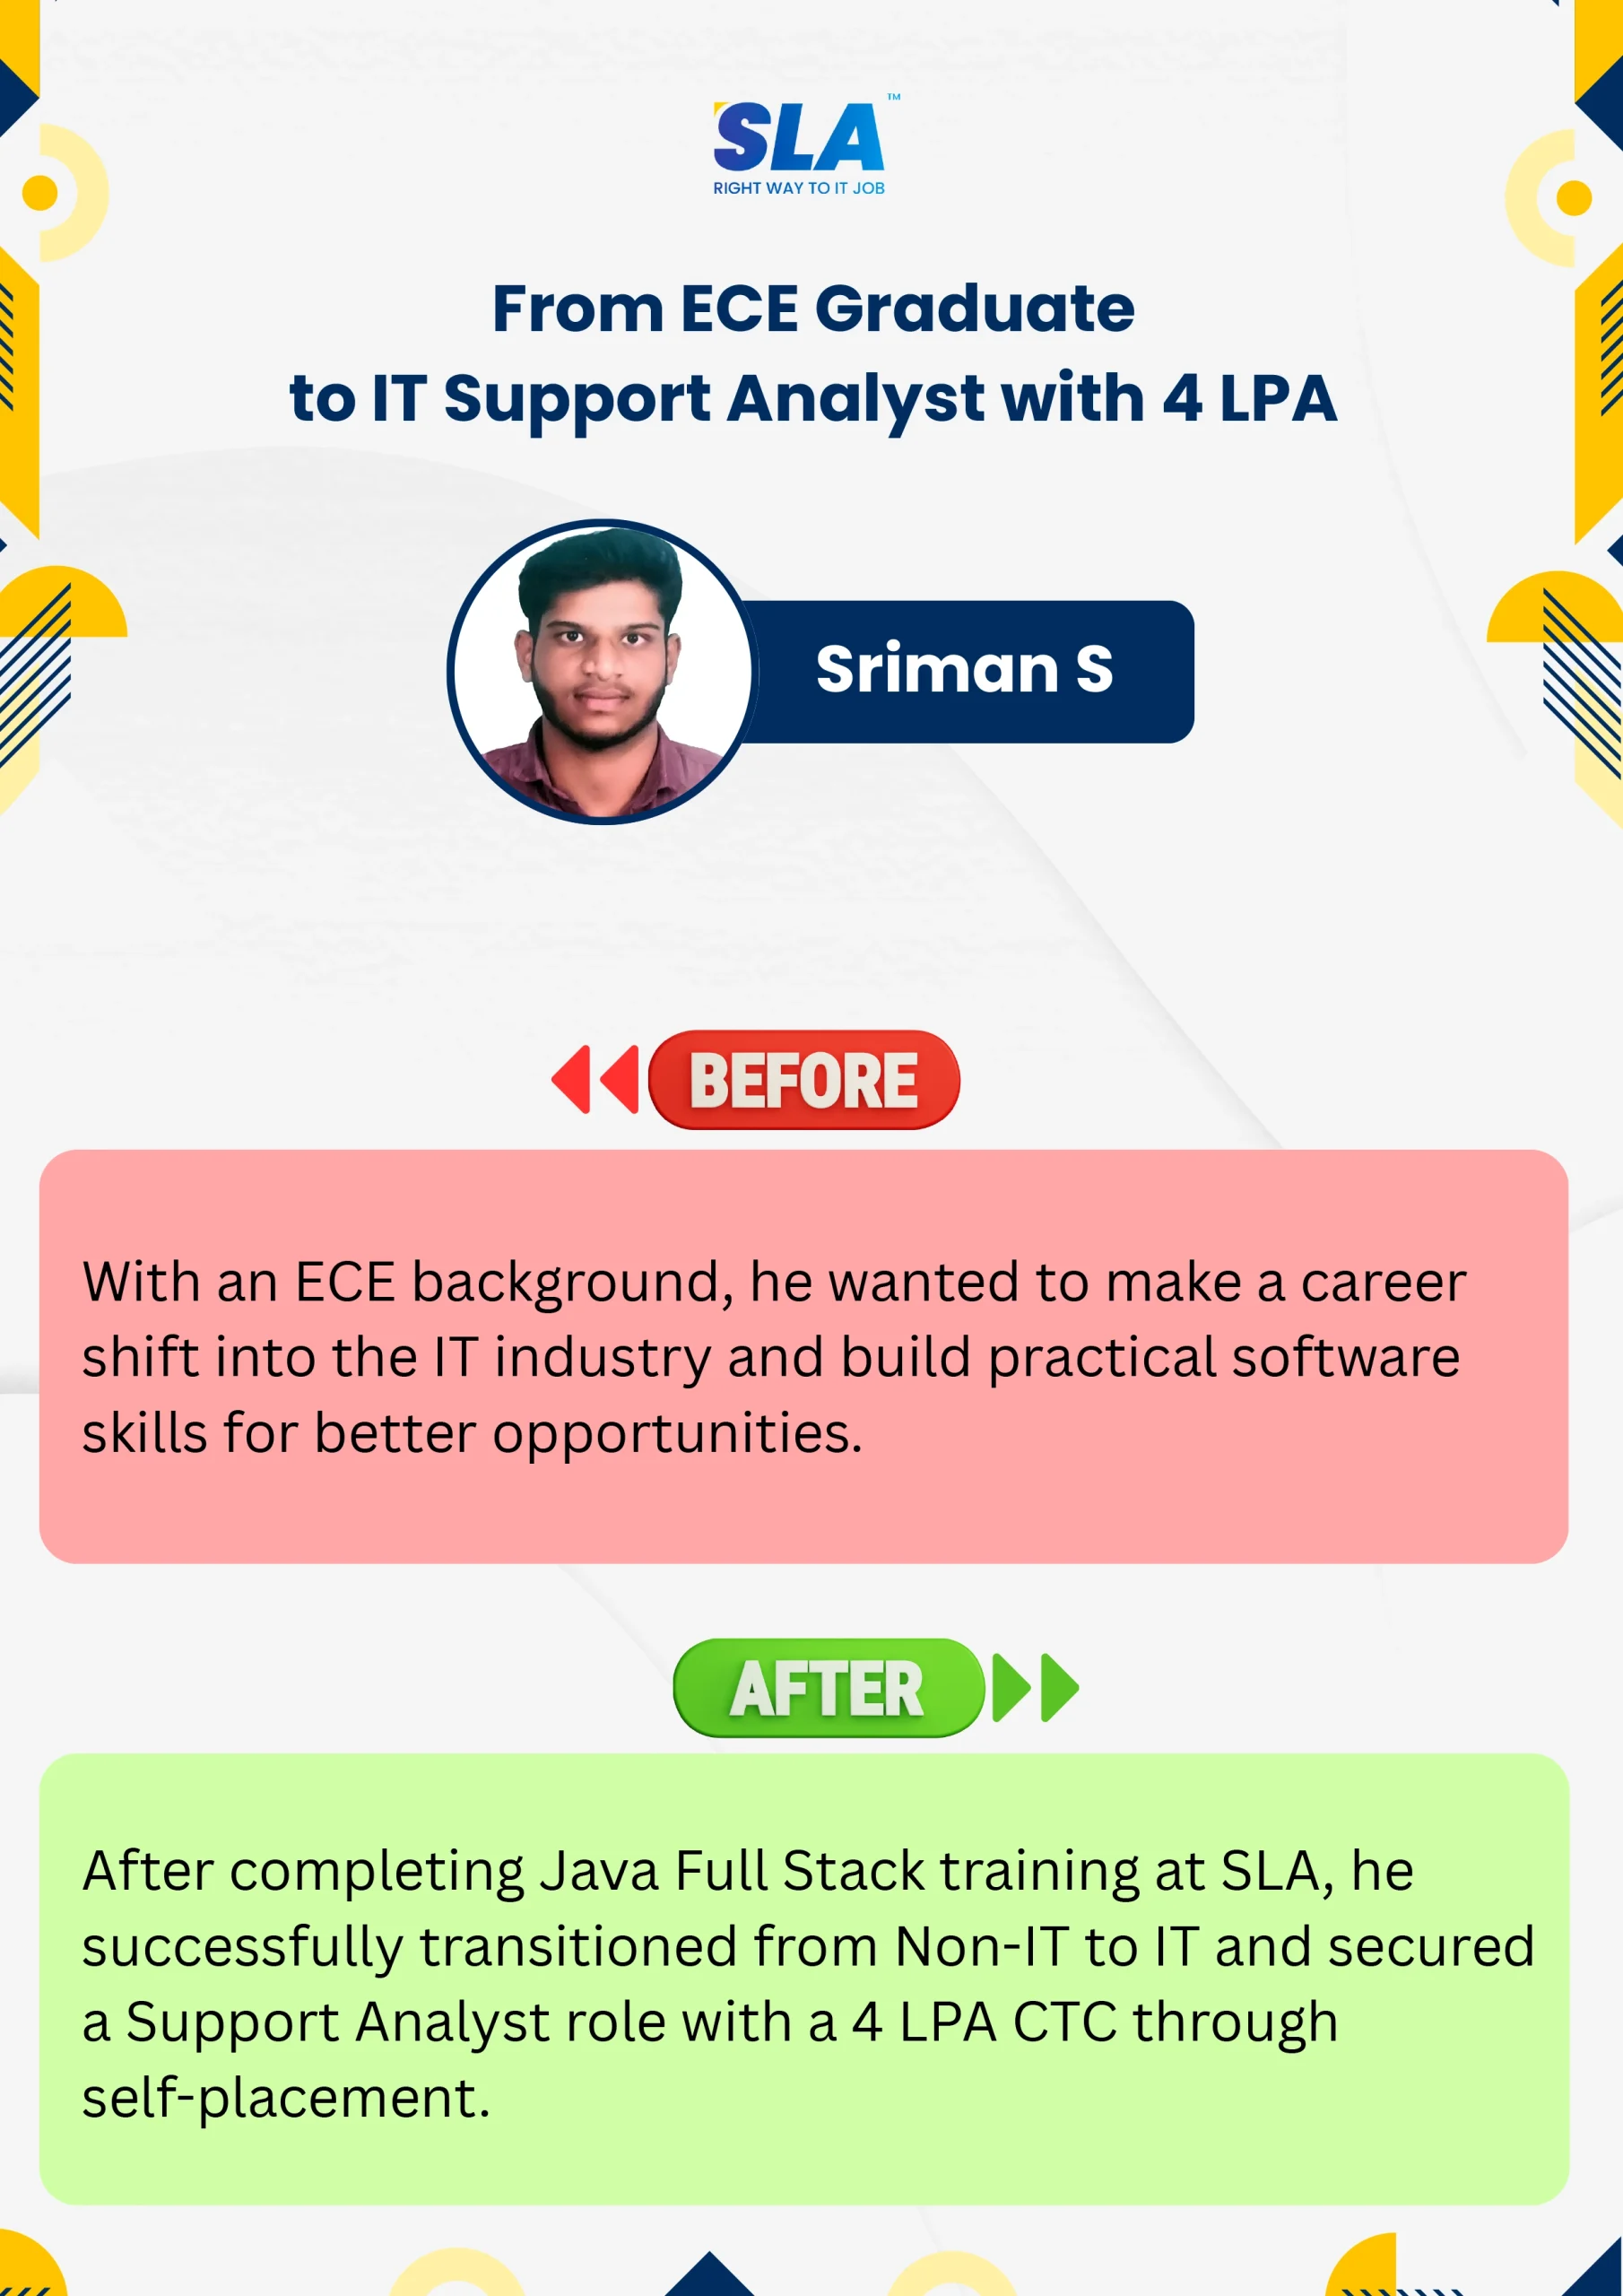
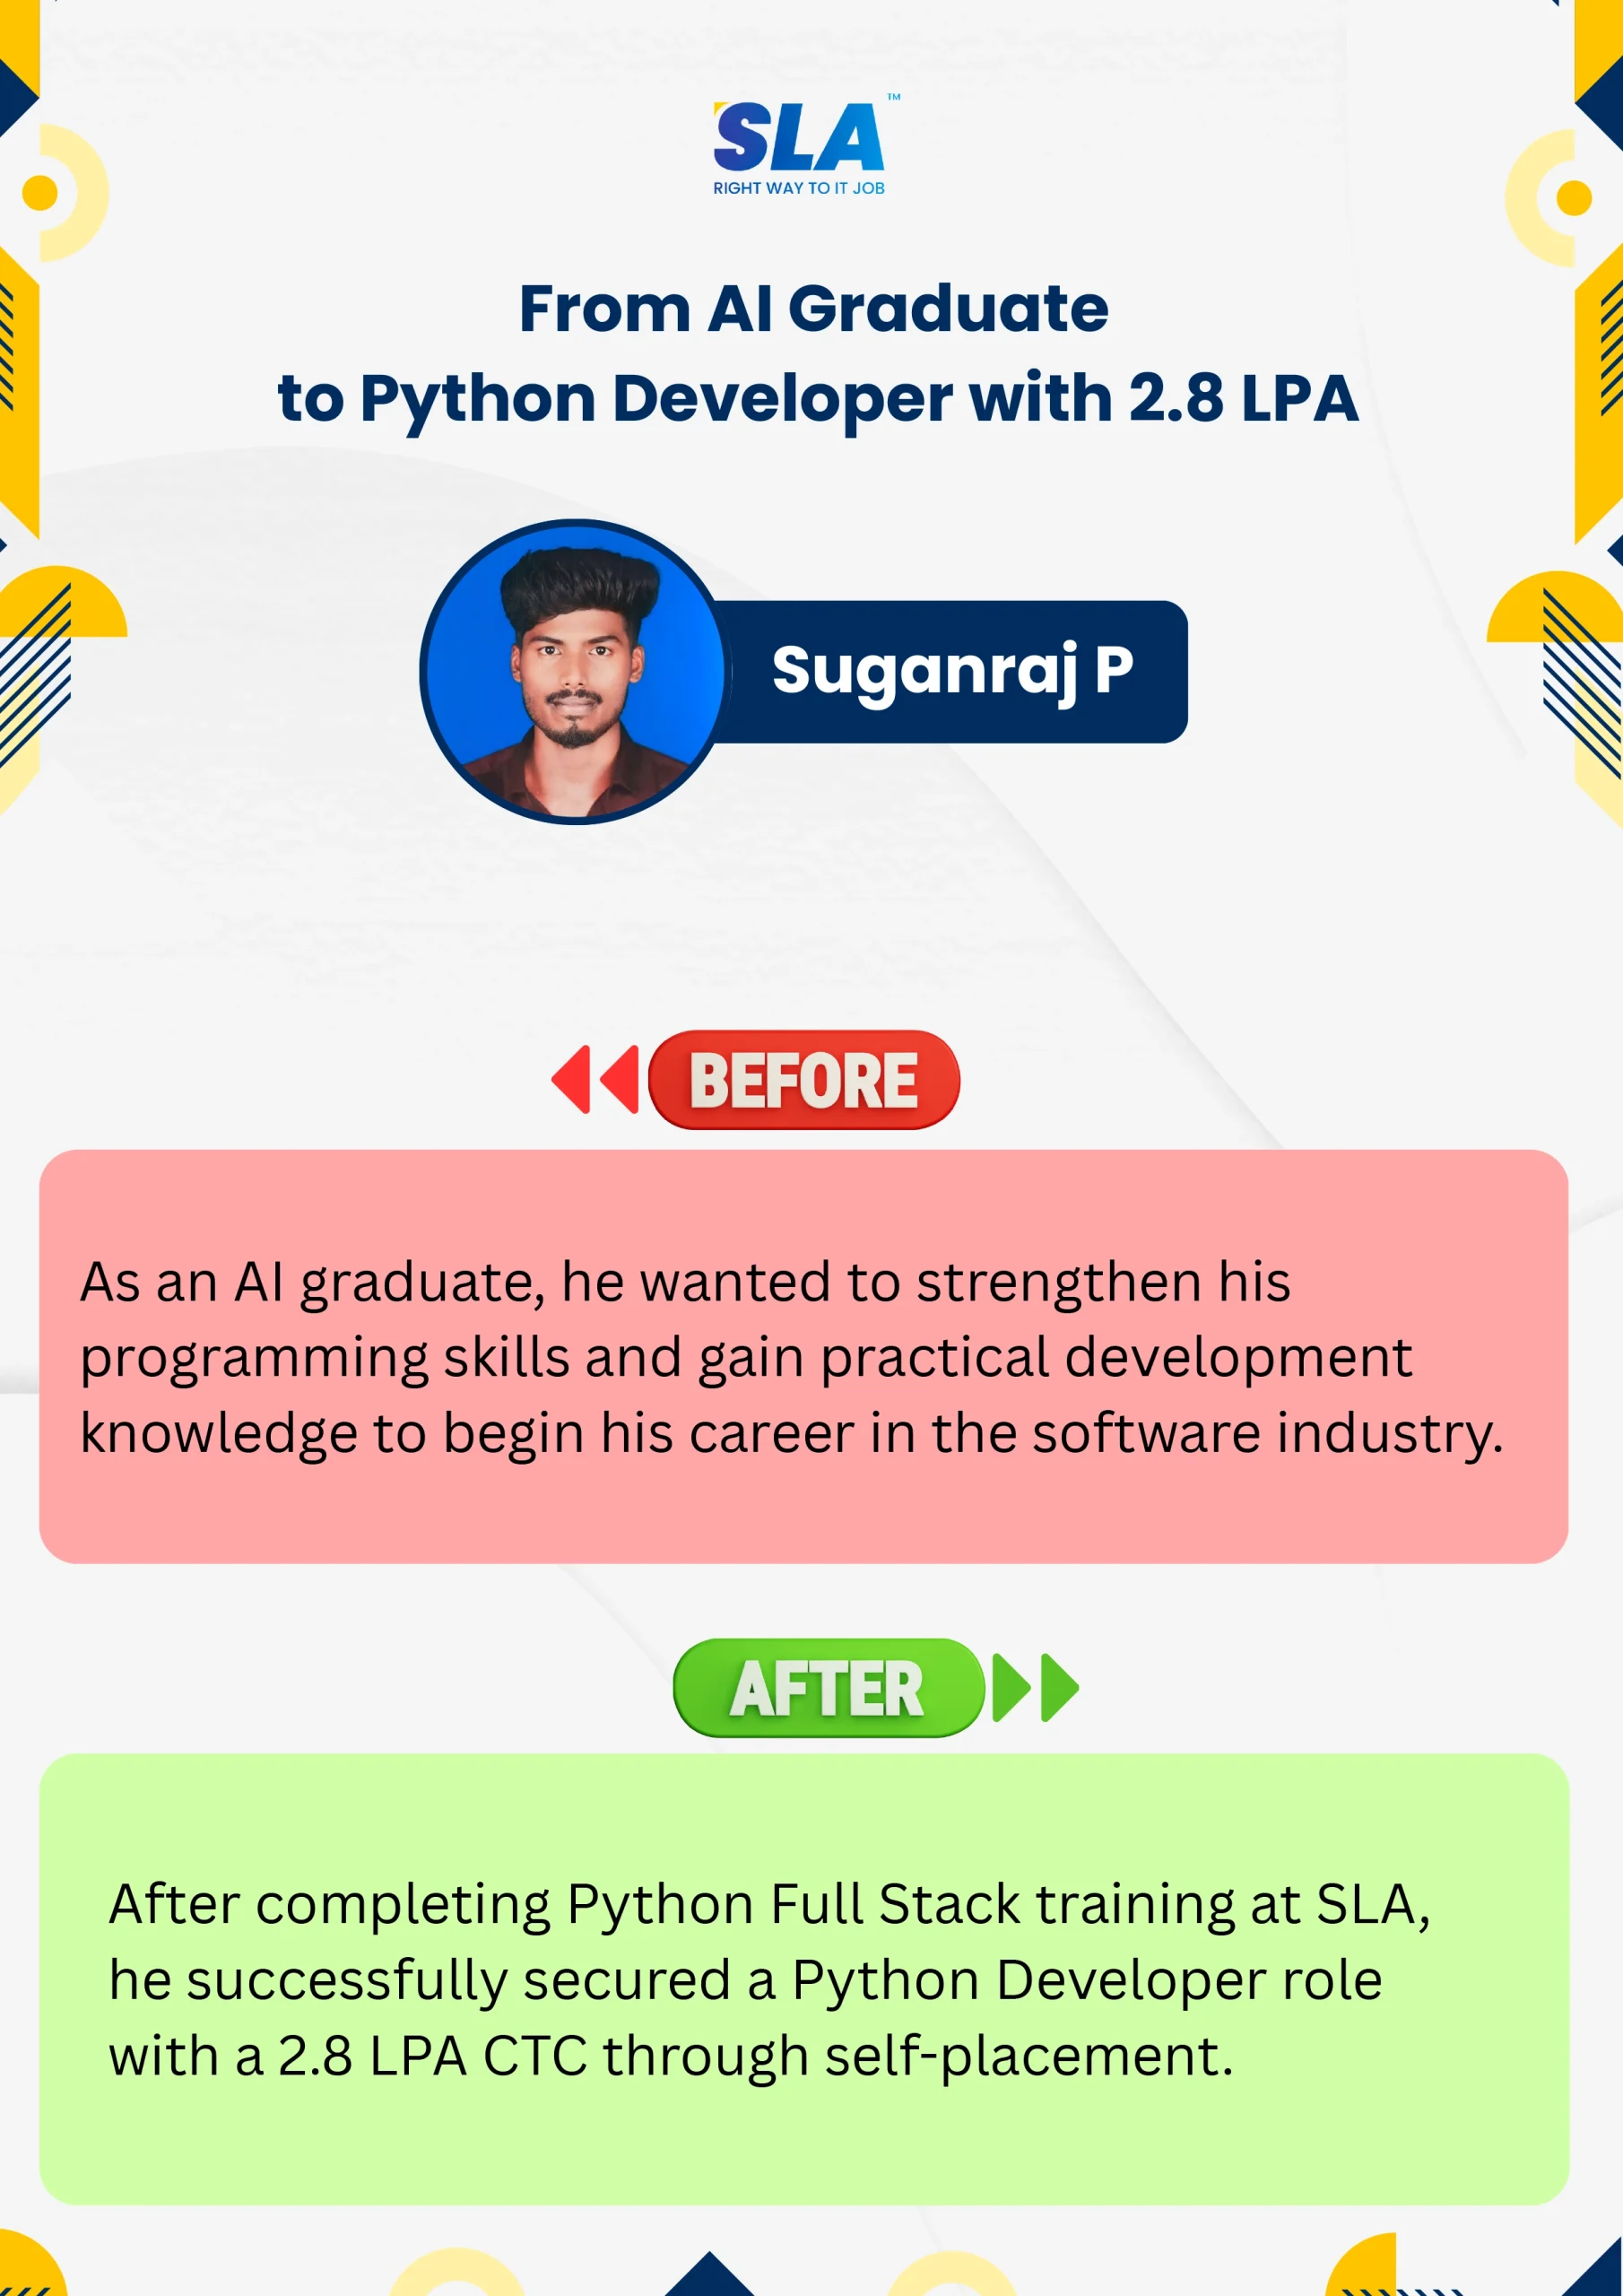
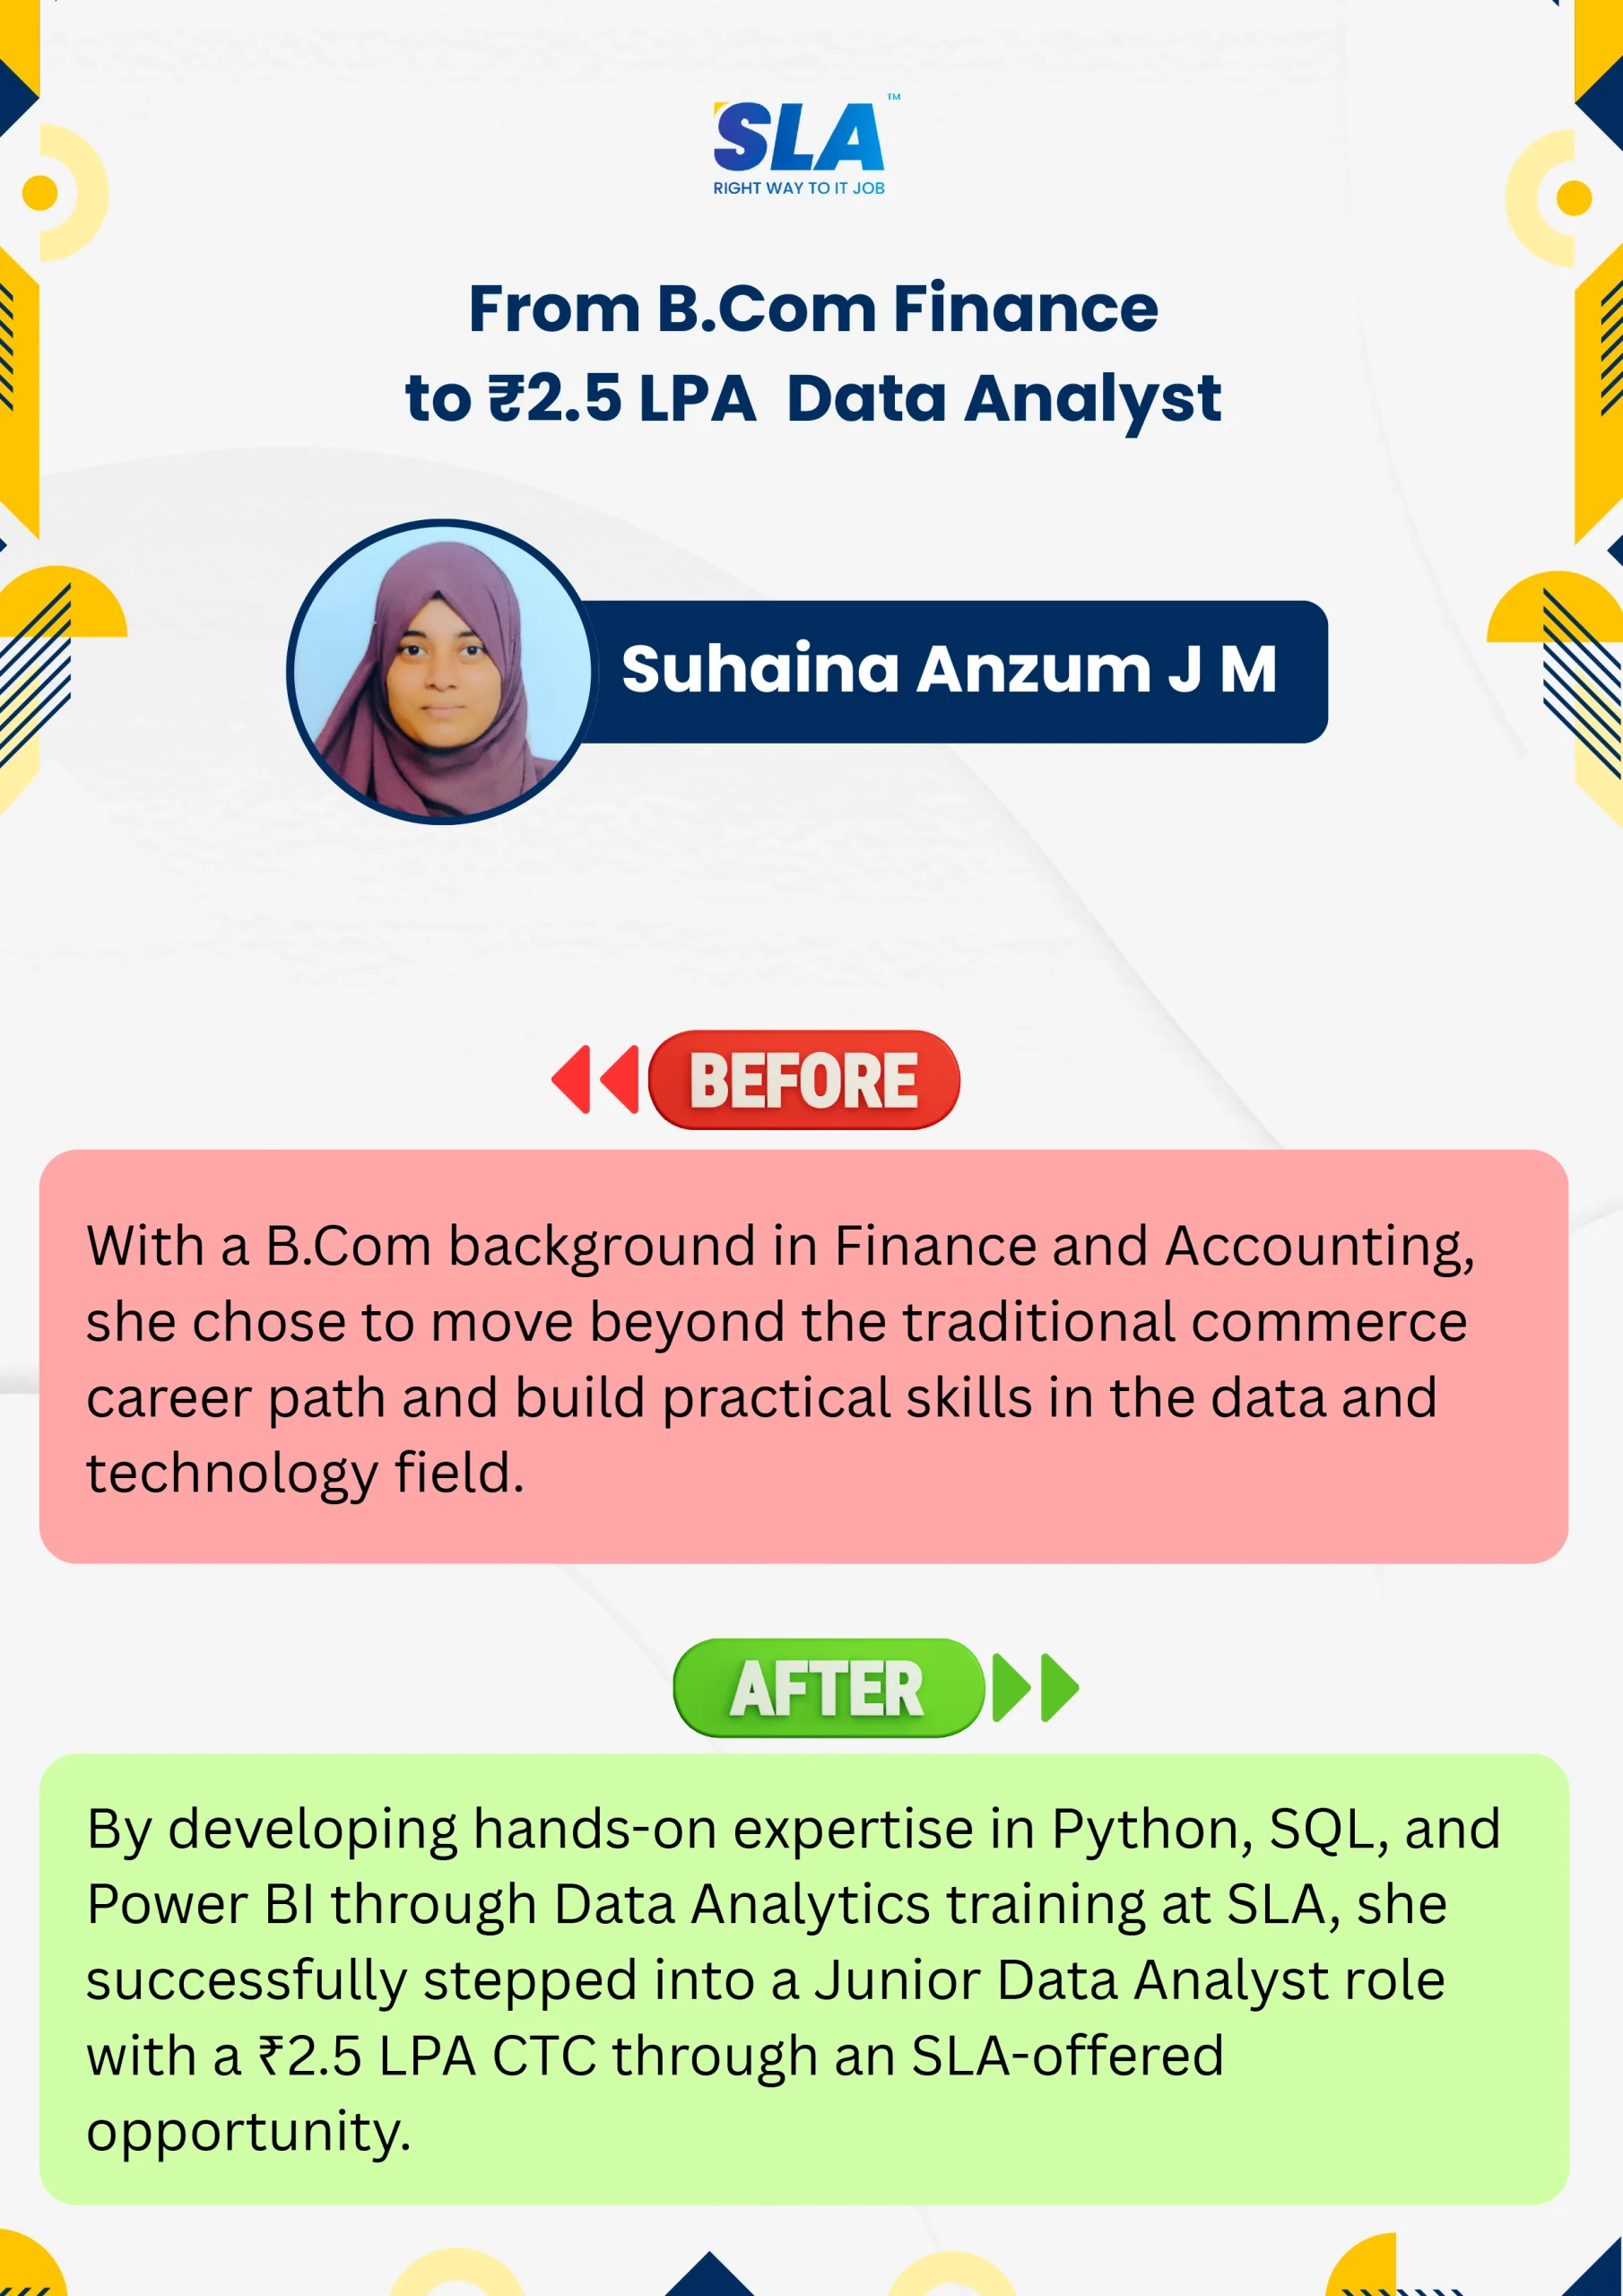
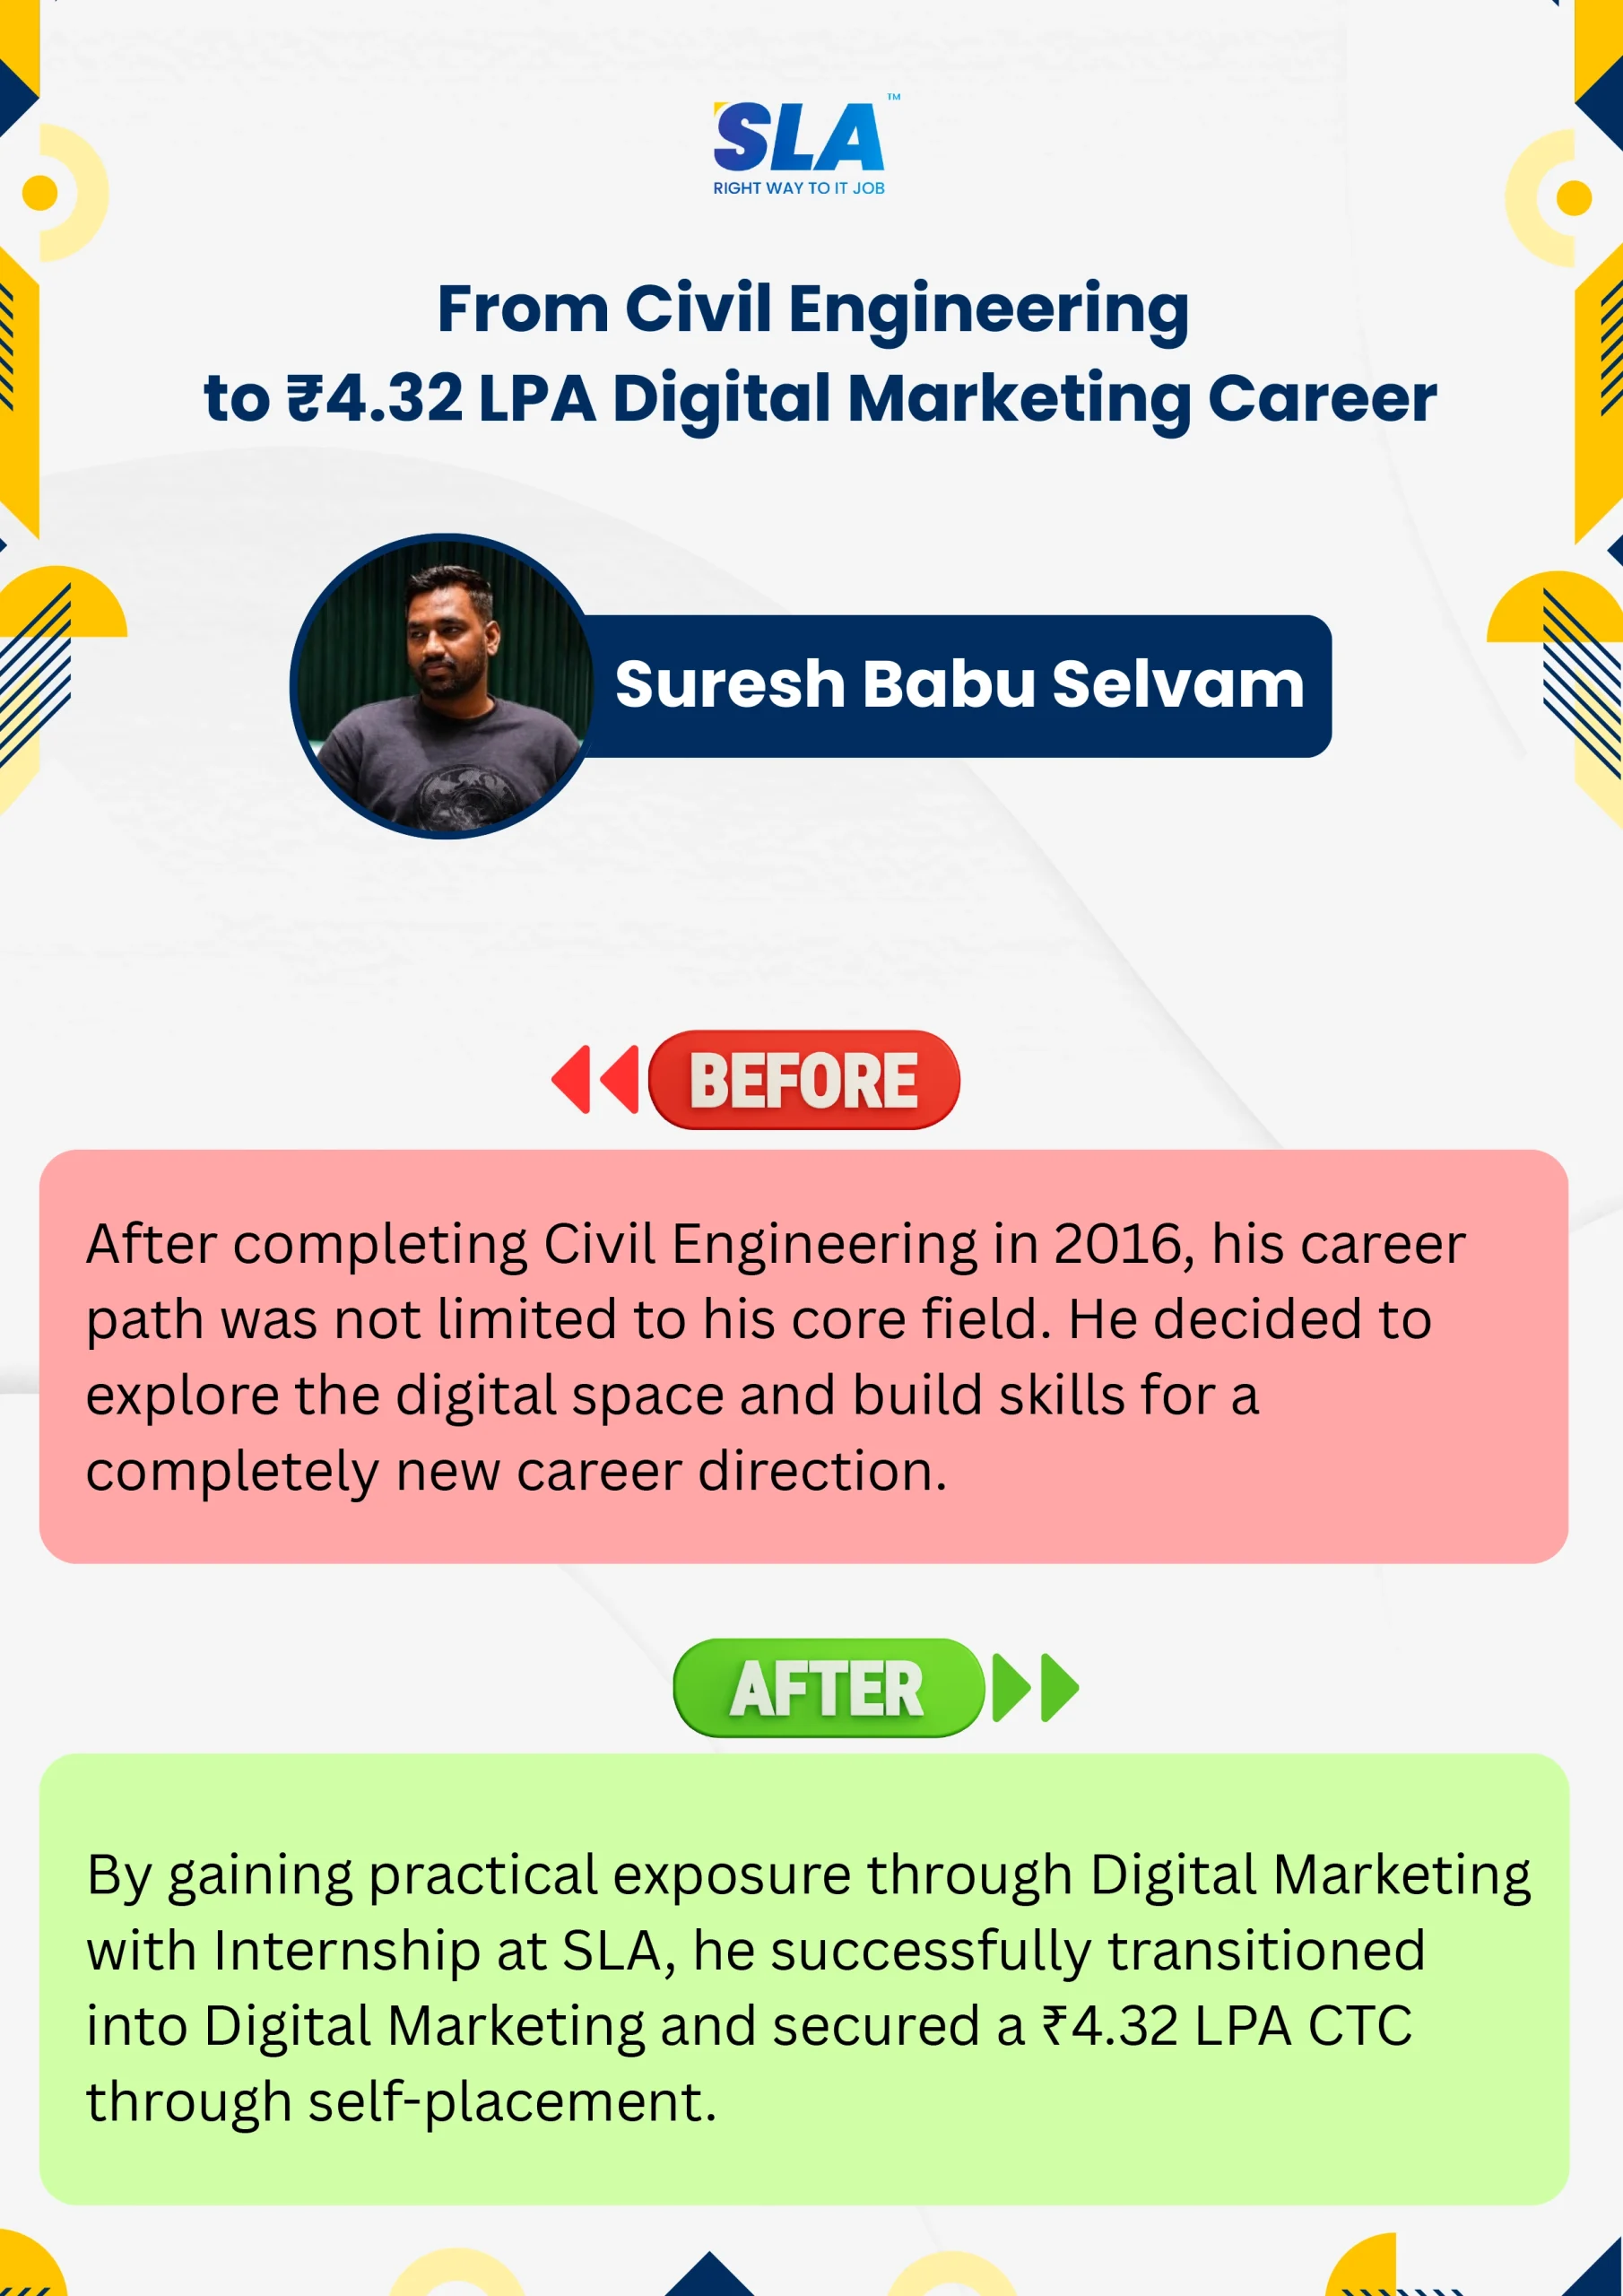
Life Changing Stories

Explore Our Students' Inspiring Leap Stories!

See More Success Stories

Google Reviews

Rating
4.8
1,053 Google reviews

SARAN M

SLA Institute provides training in communication and aptitude along with strong technical skills. The trainers explain concepts clearly with a practical approach, which helps build…
Click here for Full Review

Shaaru Menan

I had a 3 year career break. Joined SLA on Java Full Stack course and completed it.Did projects with the help of my Mentor. They…
Click here for Full Review

Nithish Sahoo

I had an excellent experience taking this DevOps course. The curriculum is well-structured and covers both fundamental and advanced DevOps concepts in a clear manner.…
Click here for Full Review

NalluKumar Ravichandran

Hi, I recently completed the DOT NET Full Stack Development course at SLA, and I had a great learning experience. The teaching style and student…
Click here for Full Review

MATHAN KUMAR G EEE

SLA Institute provides a structured learning environment for data analytics. The syllabus is relevant, and trainers are knowledgeable. Some sessions were very useful practically, while…
Click here for Full Review

 Surya

 Special thanks to Vishal Sir, the Placement Officer, for his interview guidance, resume support, and continuous motivation throughout the placement process. I would also like…
Click here for Full Review

Discover What Our Students Have To Say

See More Reviews

Listen to Our Students' Video Testimonials

Our counselors will share the Syllabus PDF with you via Email / Whatsapp

Get Your Instant Job & Placement Eligibility
Report in Just 30 Seconds!
Below 30% - not Eligible (Needs Preparation)
30% – 70% - Partially Eligible (Needs Guidance)
Above 70% - Fully Eligible (Ready to Start)

We are excited to get started with you

Give us your information and we will arange for a free call (at your convenience) with one of our counsellors. You can get all your queries answered before deciding to join SLA and move your career forward.