
Softlogic is one of the Top Training institutes for Data Analytics. Learn how to use Data Analytics, from beginner basics to advanced techniques. Our Data Analytics Syllabus covers the data analytics fundamentals, statistical analysis, data visualization, SQL, Excel, Python for analytics, and business intelligence tools. We offer a Data Analytics Course with Placement Assistance, Mock interviews, Resume building, and certification.
Data Analytics Certification Course
4.80
(6521)
DURATION

2 Months
EMI

0% Interest
Mode

Live Online / Offline

Let's take the first step to becoming an expert in Data Analytics
Click Here to Get Started
Lifelong Placement
Assistance
Get Certified
JOB PLACEMENT ELIGIBILITY TEST
×
Your Placement Eligibility Report
Want more details about Data Analytics?
Fill out the form, and our counsellors will get in touch with you at your preferred time. You can have all your queries answered. Once you decide that SLA is the perfect fit for your training needs, our counselors will guide you through the process every step of the way.

Course Schedules

Course Syllabus

Course Fees

or any other questions...
Fees, Duration & Batch Timings for Data Analytics
Hands On Training
3-5 Real Time Projects
60-100 Practical Assignments
3+ Assessments / Mock Interviews
July 2026
Week days
(Mon-Fri)
Online/Offline
2 Hours Real Time Interactive Technical Training
1 Hour Aptitude
1 Hour Communication & Soft Skills
(Suitable for Fresh Jobseekers / Non IT to IT transition)
Course Fee
July 2026
Week ends
(Sat-Sun)
Online/Offline
4 Hours Real Time Interactive Technical Training
(Suitable for working IT Professionals)
Course Fee
Save up to 20% in your Course Fee on our Job Seeker Course Series
Learn More
Syllabus of Data Analytics
Download Syllabus
CORE PYTHON
- Python Introduction & history
- Color coding schemes
- Salient features & flavors
- Application types
- Language components
- String handling management
- String operations – indexing, slicing, ranging
- String methods – concatenation, repetition, formatting
- Supporting functions
- Native data types
- List
- Tuple
- Set
- Dictionary
- Decision making statements
- If
- If…else
- If…elif…else
- Looping statements
- For loop
- While loop
- Function types
- Built-in functions
- Math functions
- User defined functions
- Recursive functions
- Lambda functions
- OOPs
- Classes and objects
- init constructor
- Self-keyword
- Data abstraction
- Data encapsulation
- Polymorphism
- Inheritance
- Exception handling
- Error vs exception
- Types of error
- User defined exception handling
- Exception handler components
- Try block, except block, finally block
POWER BI INTRODUCTION
- Data Visualization
- Reporting Business Intelligence (BI)
- Traditional BI
- Self-Serviced BI Cloud Based BI
- On Premise BI
- Power BI Products
- Power BI Desktop (Power Query, Power Pivot, Power View)
- Flow of Work in Power BI Desktop
- Power BI Report Server
- Power BI Service, Power BI Mobile
- Power BI Architecture
- A Brief History of Power BI
POWER QUERY
- Data Transformation
- Benefits of Data Transformation
- Shape or Transform Data using Power Query
- Overview of Power Query / Query Editor
- Query Editor User Interface
- The Ribbon (Home, Transform, Add Column, View Tabs)
- The Queries Pane
- The Data View / Results Pane
- The Query Settings Pane, Formula
- Bar Saving the Work
- Data types
- Changing the Data type of a Column Filters in Power Query
- Auto Filter / Basic Filtering Filter a Column using
- Text Filters Filter a Column using Number Filters
- Filter a Column using Date Filters Filter Multiple Columns
- Remove Columns / Remove Other Columns Name
- Rename a Column Reorder Columns or Sort Columns
- Add Column / Custom Column Split Columns Merge
- Columns PIVOT, UNPIVOT Columns Transpose Columns
- Header Row or Use First Row as Headers Keep Top Rows
- Keep Bottom Rows Keep Range of Rows Keep Duplicates
- Keep Errors Remove Top Rows
- Remove Bottom Rows
- Remove Alternative Rows
- Remove Duplicates, Remove Blank Rows
- Remove Errors Group Rows / Group By
M LANGUAGE
- IF..ELSE Conditions
- TransformColumn()
- RemoveColumns()
- SplitColumns()
- ReplaceValue()
- Table.Distinct() Options and GROUP BY Options
- Table.Group()
- Table.Sort() with Type Conversions
- PIVOT Operation and Table.Pivot ().
- List Functions Using Parameters with M Language
DATA MODELING
- Data Modeling Introduction Relationship
- Need of Relationship Relationship Types
- Cardinality in General
- One-to-One
- One-to-Many
- Many-to-One
- Many-to-Many
- AutoDetect the relationship
- Create a new relationship
- Edit existing relationships
- Make Relationship Active or Inactive
- Delete a relationship
DAX
- What is DAX
- Calculated Column, Measures
- DAX Table and Column Name Syntax
- Creating Calculated Columns
- Creating Measures
- Calculated Columns Vs Measures
- DAX Syntax & Operators
- Types of Operators
- Arithmetic Operators
- Comparison Operators
- Text Concatenation Operator
- Logical Operators
DAX FUNCTIONS TYPES
- Date and Time Functions
- YEAR, MONTH,DAY
- WEEKDAY, WEEKNUM FORMAT (Text Function)
- Month Name, Weekday Name
- IF
- TRUE, FALSE NOT,
- OR, IN, AND
- Text Function
- LEN, CONCATENATE
- LEFT, RIGHT, MID UPPER
- LOWER TRIM, SUBSTITUTE, BLANK
- Logical Functions
- IF TRUE, FALSE NOT
- OR, IN, AND IF ERROR SWITCH
- Math & Statistical Functions
- INT ROUND, ROUNDUP
- ROUNDDOWN
- DIVIDE EVEN, ODD
- POWER, SIGN SQRT
- FACT SUM, SUMX MIN, MINX MAX
- MAXX COUNT,
- COUNTX AVERAGE
- AVERAGEX COUNTROWS
- COUNTBLANK
REPORT VIEW
- Report View User Interface
- Fields Pane
- Visualizations pane
- Ribbon, Views, Pages Tab
- Canvas Visual Interactions Interaction Type (Filter, Highlight, None)
- Visual Interactions Default Behavior, Changing the Interaction
- Grouping and Binning Introduction
- Using grouping, Creating Groups on Text Columns
- Using binning, Creating Bins on Number Column and Date Columns
- Sorting Data in Visuals
- Changing the Sort Column
- Changing the Sort Order
- Sort using column that is not used in the Visualization
- Sort using the Sort by Column button
- Hierarchy Introduction
- Default Date Hierarchy
- Creating Hierarchy
- Creating Custom Date Hierarchy
- REPORT VIEW
- Change Hierarchy Levels
- Drill-Up and Drill-Down Reports
- Data Actions, Drill Down, Drill Up, Show Next Level
- Expand Next Level Drilling filters other visuals option
VISUALIZATIONS
- Visualizing Data
- Why Visualizations
- Visualization types
- Create and Format Bar and Column Charts
- Create and Format Stacked Bar Chart
- Stacked Column Chart
- Create and Format Clustered Bar Chart
- Clustered Column Chart
- Create and Format 100% Stacked Bar Chart 100% Stacked Column Chart
- Create and Format Pie and Donut Charts
- Create and Format Scatter Charts
- Create and Format Table Visual
- Matrix Visualization
- Line and Area Charts
- Create and Format Line Chart, Area Chart
- Stacked Area Chart Combo Charts
- VISUALIZATIONS
- Create and Format Line and Stacked Column Chart
- Line and Clustered Column Chart
- Create and Format Ribbon Chart
- Waterfall Chart, Funnel Chart
POWER BI SERVICE
- Power BI Service Introduction
- Power BI Cloud Architecture
- Creating Power BI Service Account
- SIGN IN to Power BI Service Account
- Publishing Reports to the Power BI service
- Import / Getting the Report to PBI Service
- My Workspace / App Workspaces Tabs
- DATASETS, WORKBOOKS, REPORTS & DASHBOARDS
- Working with Datasets Creating Reports in Cloud using Published
- Datasets
- Creating Dashboards Pin Visuals and Pin LIVE
- Report Pages to Dashboard
- Advantages of Dashboards Interacting with
- Dashboards
- Formatting Dashboard, Sharing Dashboard
ADVANCED PANDAS FUNCTIONS
- Group by()
- Pivot tables()
- Multi-indexing()
- merge()
- concatenate()
- join()
- data transformation using apply()
- map()
- query()
- Resampling time series functionality
- excel writer()
- pipe()
- creating dataframes
- reading CSV files with intrinsic index
- converting CSV files to dataframes
- converting dataframes to CSV files
- converting dataframes to excel file
ADVANCED SQL FUNCTIONS
- Common Table Expressions (CTE)
- Recursive CTE’s
- temporary functions
- pivoting data with sum() and CASE WHEN
- Except vs Not in
- self joins, rank vs dense_rank vs row number
- ranking data
- calculating delta values,
- multiple groupings using rollup
- calculating running totals
- computing a moving average
- date time manipulations
- Formatting strings, stored methods
- JOINS
- Sub Queries
- Manipulation of date and time
- procedural data storage
- Connecting SQL to Python or R language, window Functions
PROJECT
- Project1 – Product Sales Analysis – Power BI Project and review
- Project2 – Financial Performance Analysis – Power BI Project and review
- Project3 – Health care sales Analysis –
- Intermediate Power BI project and review
- Project4 – Anamoly detection in Credit card transactions – Intermediate Power BI project and review
Objectives of Data Analytics
The Data Analytics Training will cover all the topics ranging from fundamental to advanced concepts, which will make it easy for students to grasp Data Analytics. The Data Analytics Course Curriculum is composed of some of the most useful and rare concepts that will surely give students a complete understanding of Data Analytics as well. So, some of those curriculum are discussed below as objectives:
- To make students well-versed with fundamental concepts in Data Analytics like – Core Python, Power BI, Power Query, M Language, Data Modeling etc.
- To make students know more about Data Analytics by exploring topics like – Visualization, Power BI Service, Advanced Pandas Function etc.
- To make students knowledgeable in advanced concepts in Data Analytics by making them learn topics like – Advanced SQL Functions – Common Table Expressions (CTE), Recursive CTE’s, temporary functions, pivoting data with sum() and CASE WHEN, Except vs Not in etc.
Request a Free Callback
Why Softlogic Systems is the Best Choice for Data Analytics – Learn, Practice, and Get Placed!

Online & Offline Training Options
Learn at your convenience with flexible classroom and live online training.

Learn from 100+ Real-Time Developers
Get trained by industry professionals with years of hands-on experience.

Hands-on Projects & Codeathons
Practice with real-time projects and coding challenges to build confidence.
0% EMI Fee Options
Pay your course fees flexibly with easy EMI plans at zero interest.

Resume & Interview Support
Get expert help with resume building, mock interviews, and soft skills.

Placement with Top IT Firms
Access placement opportunities with leading MNCs and IT companies.

1000+ Hiring Partners
Benefit from Softlogic’s strong recruiter network for faster job placement.

No Backdoor Jobs
We ensure only genuine placement opportunities with trusted companies.
Request a Free Callback
Highlights of Data Analytics
What is Data Analytics?
Data Analytics is the process of systematically analyzing data to identify patterns, trends, and insights that guide decision-making. It utilizes methods like statistical analysis, data mining, and machine learning to interpret and visualize data, enabling organizations to make well-informed decisions and address complex challenges.
What is Data Analytics Full Stack?
Data Analytics Full Stack covers all stages of the analytics workflow, including data collection, cleaning, analysis, and visualization. It involves managing data storage, applying advanced analytics like machine learning, and deploying solutions into business applications. Mastering these components ensures a complete approach to data-driven decision-making.
What are the reasons for learning Data Analytics?
The following are the prerequisites for learning Data Analytics:
- Enhanced Decision-Making: Data analytics delivers actionable insights that facilitate informed decisions across various industries.
- Diverse Career Paths: Mastery in data analytics opens up a variety of job roles in fields like finance, healthcare, technology, and marketing.
- Complex Problem-Solving: By examining data, you can identify and address complex issues through trend and pattern recognition.
- Operational Efficiency: Data analytics helps optimize processes and operations, leading to increased efficiency and reduced costs
What are the prerequisites for learning Data Analytics?
The following are the prerequisites for learning Data Analytics:
- Mathematics and Statistics: Basic knowledge of mathematics and statistics, including concepts like descriptive statistics, probability, and inferential statistics, is essential.
- Spreadsheet Skills: Proficiency in spreadsheet tools such as Microsoft Excel or Google Sheets for data manipulation, analysis, and visualization.
- Database Fundamentals: Understanding database principles and basic SQL (Structured Query Language) for querying and managing data.
- Programming Knowledge: Familiarity with programming languages like Python or R, commonly used for data analysis tasks.
What are the course fees and duration?
Our Data Analytics Course Fees may vary depending on the specific course program you choose (basic / intermediate / full stack), course duration, and course format (remote or in-person). On an average the Data Analytics Course Fees range from 55k to 60k, for a duration of 3 months with international certification based on the above factors.
What are some of the jobs related to Data Analytics?
The following are the jobs related to Data Analytics:
- Data Analyst
- Data Scientist
- Business Intelligence (BI) Analyst
- Data Consultant
- Quantitative Analyst
- Data Engineer
List a few real time Data Analytics applications.
The following are the Data Analytics real-time applications:
- Fraud Detection
- Stock Market Analysis
- Customer Experience Management
- Network Security
- Supply Chain Management
- Healthcare Monitoring
Boost Your Skills with Our Data Analytics Experts
Our Mentors are from Top Companies like:
- Our Data Analytics instructors are highly skilled professionals with extensive technical knowledge and expertise in analytics. They bring significant experience in managing and executing data-driven solutions.
- They develop thorough study materials to assist learners in mastering the fundamentals of data analytics and exploring various analytical fields.
- Our trainers have an in-depth understanding of data analytics certification and guide students through concepts such as data exploration, machine learning algorithms, Big Data fundamentals, and data visualization.
- They excel in preparing students for certification exams by employing real-world scenarios and mentoring techniques. Their excellent communication and interpersonal skills facilitate effective instruction and student engagement.
- They are capable of deploying secure, high-performance data solutions and configuring servers for advanced computing tasks.
- Additionally, they can develop and deploy applications throughout the software development life cycle. By using analytics platforms and techniques, they evaluate student performance and offer constructive feedback to enhance their analytics skills.
- Their collaborative approach and enthusiasm help students gain the necessary knowledge and achieve their career goals effectively.
Request a Free Callback
What Modes of Training are available for Data Analytics?
Offline / Classroom Training

A Personalized Learning Experience with Direct Trainer Engagement!
- Direct Interaction with the Trainer
- Clarify doubts then and there
- Airconditioned Premium Classrooms and Lab with all amenities
- Codeathon Practices
- Direct Aptitude Training
- Live Interview Skills Training
- Direct Panel Mock Interviews
- Campus Drives
- 100% Placement Support
Online Training

Instructor Led Live Training! Learn at the comfort of your home
- No Recorded Sessions
- Live Virtual Interaction with the Trainer
- Clarify doubts then and there virtually
- Live Virtual Interview Skills Training
- Live Virtual Aptitude Training
- Online Panel Mock Interviews
- 100% Placement Support
Corporate Training

Blended Delivery model (both Online and Offline as per Clients’ requirement)
- Industry endorsed Skilled Faculties
- Flexible Pricing Options
- Customized Syllabus
- 12X6 Assistance and Support
GET Free Consultation
Certifications
Take your career to new heights with Softlogic's software training certifications.
Improve your abilities to get access to rewarding possibilities
Improve your abilities to get access to rewarding possibilities

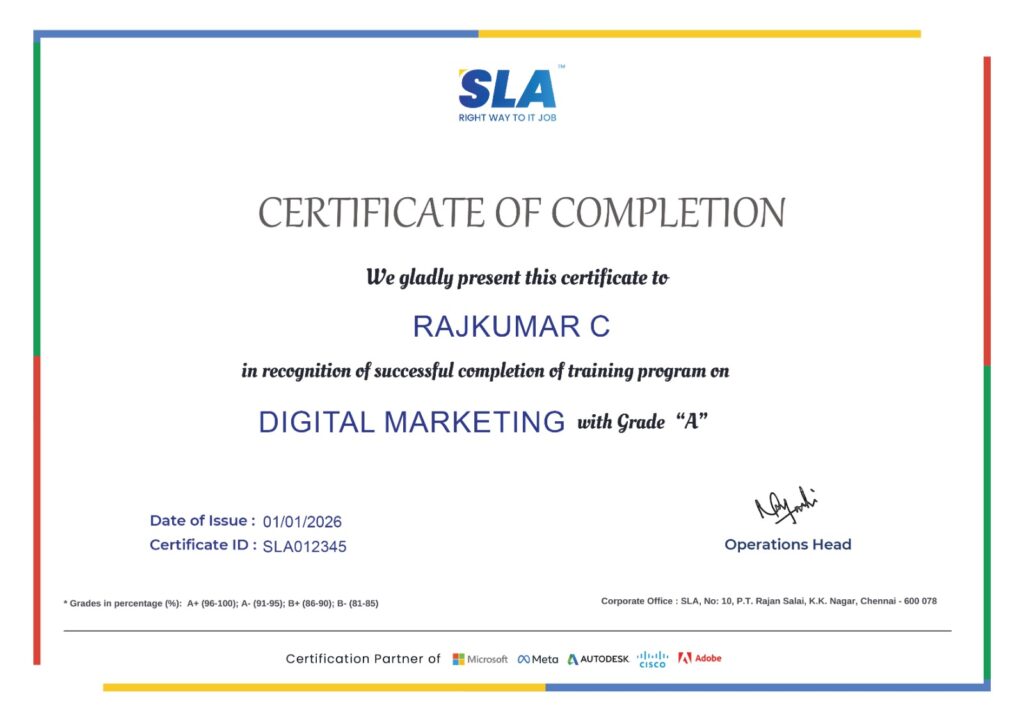
Earn Your Certificate of Completion
Validate your achievements with Softlogic's Certificate of Completion, verifying successful fulfillment of all essential components.
Take Your Career to the Next Level with Certifications
Get a certifications through our training programs to gain a competitive edge in the industry.

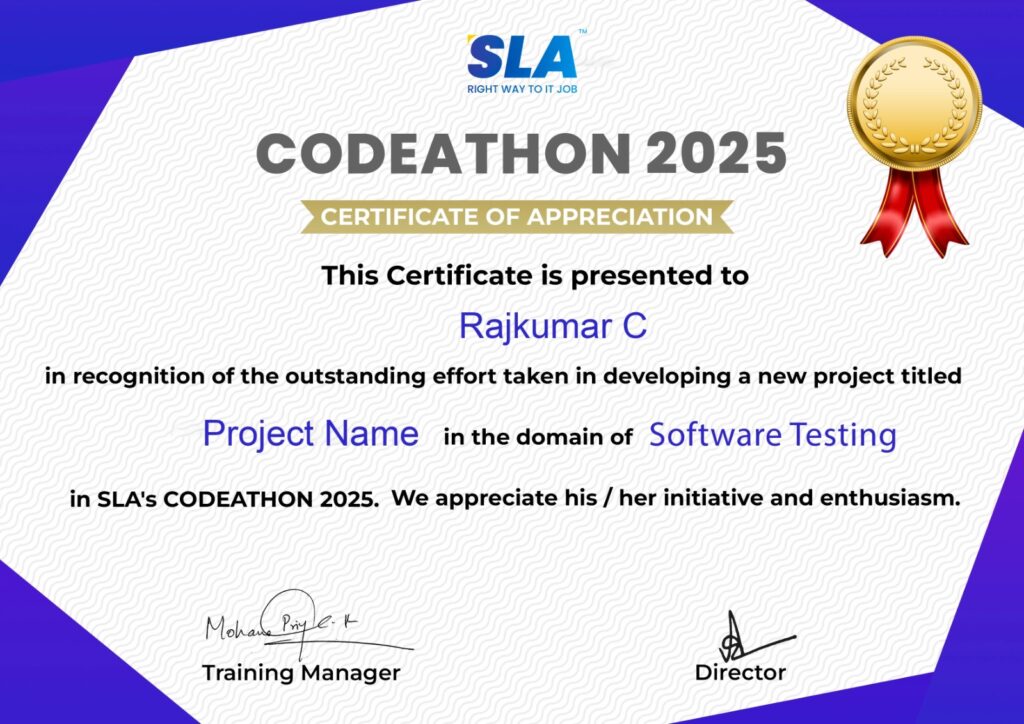
Stand Out from the Crowd with Codethon Certificate
Verify the authenticity of your real-time projects with Softlogic's Codethon certificate.
Hands-on Project Practices in Data Analytics
Supply Chain Analysis
Fraud Detection
Dashboard Development
A/B Testing
Sentiment Analysis
Churn Prediction
Market Basket Analysis
Sales Prediction
Customer Segmentation
The SLA Way to Get Placed in Top IT Companies
Enrollment

Technology Training
Coding Practices
Realtime Projects
Realtime Projects
Placement Training
Aptitude Training
Interview Skills
Interview Skills
Panel Mock
Interview

Unlimited
Interviews

Interview
Feedback

100%
IT Career
Placement Support for a Data Analytics Job
Genuine Placements. No Backdoor Jobs at Softlogic Systems.

Aptitude Training
from Day 1
Interview Skills
from Day 1

Softskills Training
from Day 1
Build Your Resume

Build your LinkedIn Profile

Build your GitHub
digital portfolio

Panel Mock Interview
Unlimited Interviews until you get placed

Life Long Placement Support at no cost
Request a Free Callback
FAQs
How do descriptive, diagnostic, predictive, and prescriptive analytics differ from one another?
Descriptive analytics summarizes past data to provide insights into what happened. Diagnostic analytics investigates why something happened. Predictive analytics estimates future trends using historical data, while prescriptive analytics advises on actions to achieve particular objectives or results.
What methods do you use to address missing data in a dataset?
Missing data can be handled through various methods such as imputation (replacing missing values with statistical estimates), deletion (removing rows or columns with missing data), or using algorithms designed to handle missing values directly.
What are the advantages of using machine learning algorithms in data analysis?
Machine learning algorithms can uncover complex patterns and relationships in large datasets, automate predictive modeling, and adapt to new data over time, providing more accurate and dynamic insights.
What measures do you take to maintain data privacy and security during analysis?
Ensuring data privacy and security involves implementing encryption, access controls, anonymizing sensitive data, and adhering to regulatory standards such as GDPR or HIPAA to protect data throughout the analysis process.
What are some common challenges in data visualization?
Common challenges include choosing the right type of visualization for the data, ensuring clarity and readability, avoiding misleading representations, and effectively communicating insights to diverse audiences.
How do you evaluate the performance of a predictive model?
The performance of a predictive model can be evaluated using metrics such as accuracy, precision, recall, F1 score, ROC-AUC, and mean squared error, depending on the type of model and the nature of the data.
What is the role of SQL in data analytics?
SQL (Structured Query Language) is used for querying, managing, and manipulating relational databases. It allows analysts to retrieve, filter, and aggregate data efficiently, which is essential for performing data analysis.
What is your method for integrating data from various sources?
Data integration is the process of merging data from multiple sources to create a consolidated view. This can be achieved through data cleaning, transformation, and mapping processes, using tools and techniques such as ETL (Extract, Transform, Load) and data warehousing.
Where is the corporate office of the Softlogic Systems located?
The corporate office of the Softlogic Systems is located at the K.K.Nagar.
What payment methods does Softlogic accept?
Softlogic accepts a wide range of payment methods, including:
- Cash
- Debit cards
- Credit cards (MasterCard, Visa, Maestro)
- Net banking
- UPI
- Including EMI
Additional Information for
the Data Analytics
Scopes available in the future for learning Data Analytics
The following are the scopes available in the future for learning the Data Analytics Course:
- Advanced Machine Learning: Applying advanced machine learning techniques, including deep learning and neural networks, for more precise predictive and prescriptive analytics.
- Big Data Technologies: Gaining expertise in big data tools such as Hadoop and Spark to manage and analyze extensive datasets.
- Real-Time Analytics: Creating systems for real-time data processing and analysis to facilitate prompt decision-making.
- Data Privacy and Ethics: Focusing on data privacy regulations, ethical issues, and best practices for data security.
- Automated Analytics: Using automation tools to optimize data processing and analysis workflows.
- Augmented Analytics: Utilizing augmented analytics tools that leverage AI for enhanced data discovery and insight generation.
- Data Storytelling: Developing skills in data visualization and storytelling to clearly communicate insights to non-technical audiences.
- IoT Data Analysis: Analyzing data from Internet of Things (IoT) devices for various applications in sectors like healthcare, manufacturing, and smart cities.
Related Blogs
Data Analyst Course Fees in Chennai
Published On: June 12, 2025
Are you curious about the data analyst course fees in Chennai? With data driving decisions…
Data Analyst Course Eligibility
Published On: February 18, 2025
Understanding the data analyst course eligibility is key to entering the field of data analytics.…
Data Analytics Challenges Facing Businesses
Published On: November 5, 2024
Introduction Data analysts will increasingly collaborate closely with marketing, finance, operations, and other departments to…
Data Analytics Project Ideas
Published On: November 2, 2024
Introduction Learning Data Analytics Project Ideas is one of the best ways for students and…
Data Analyst Salary For Freshers and Experienced
Published On: September 21, 2024
Introduction Data Analysts play a central role in converting raw data into meaningful business insights…
Data Analytics Tutorial for Beginners
Published On: August 8, 2024
Introduction Ever stare at a "wall of numbers" and have no clue where to start?…
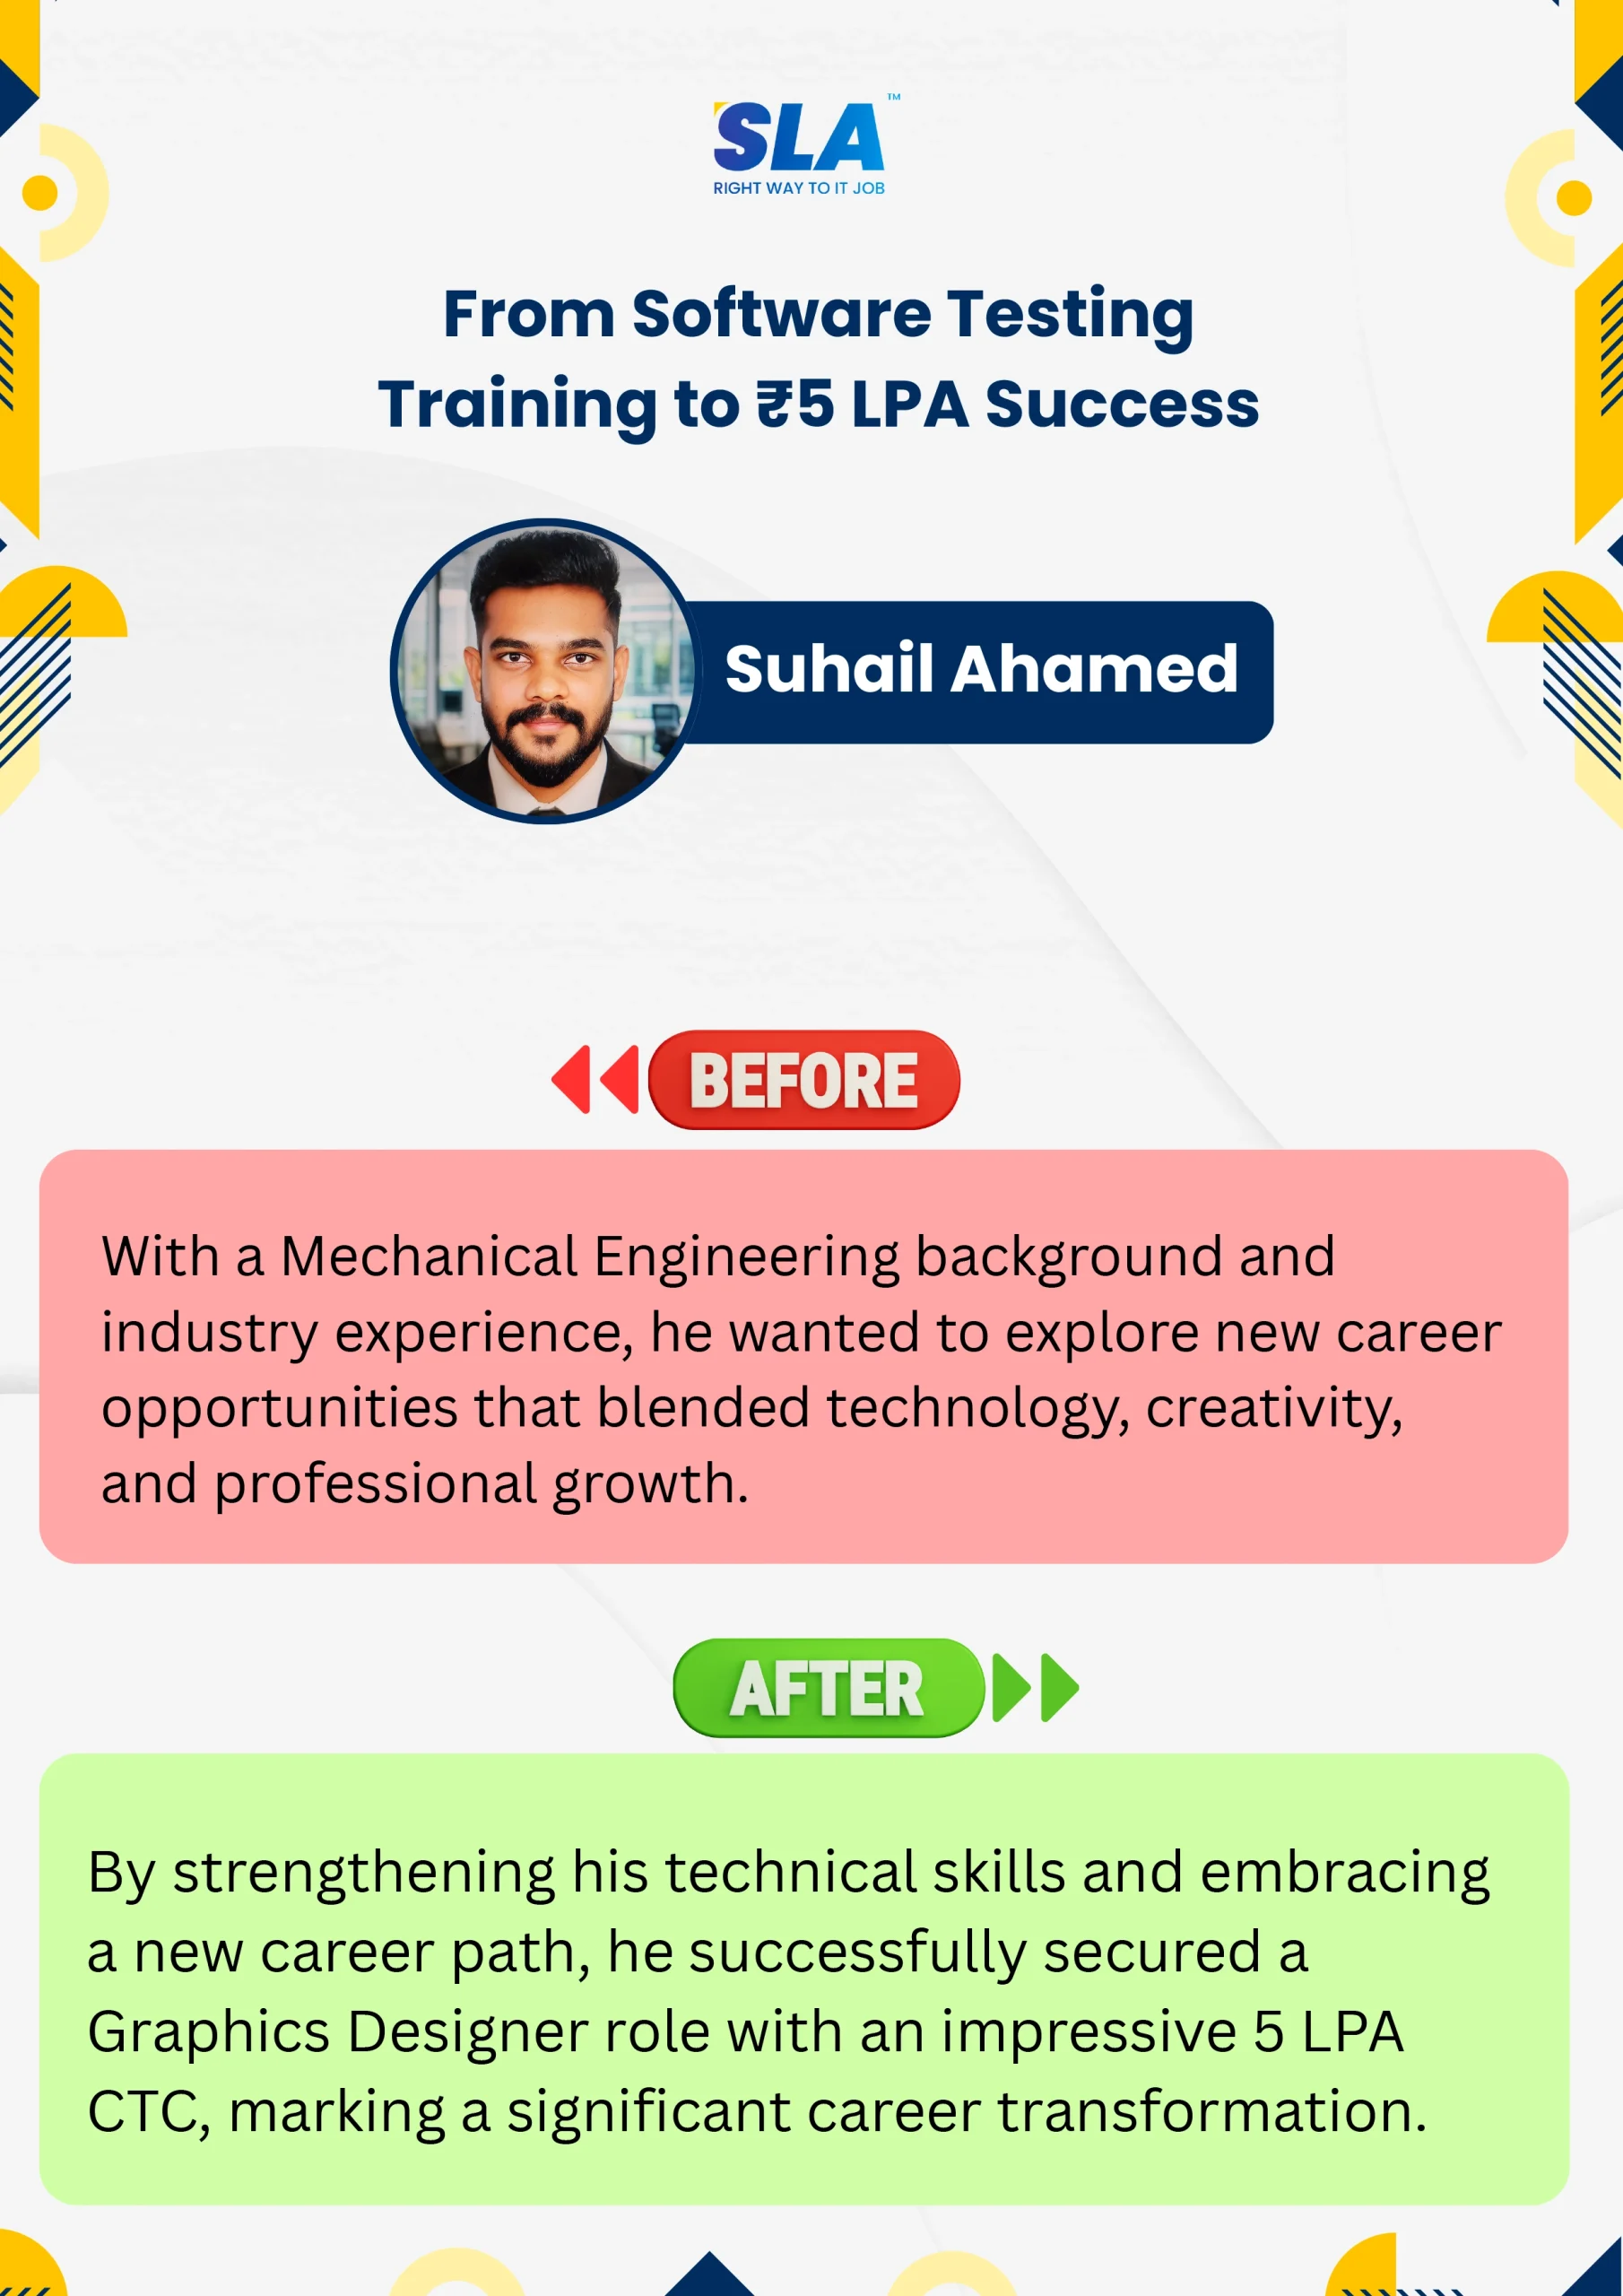

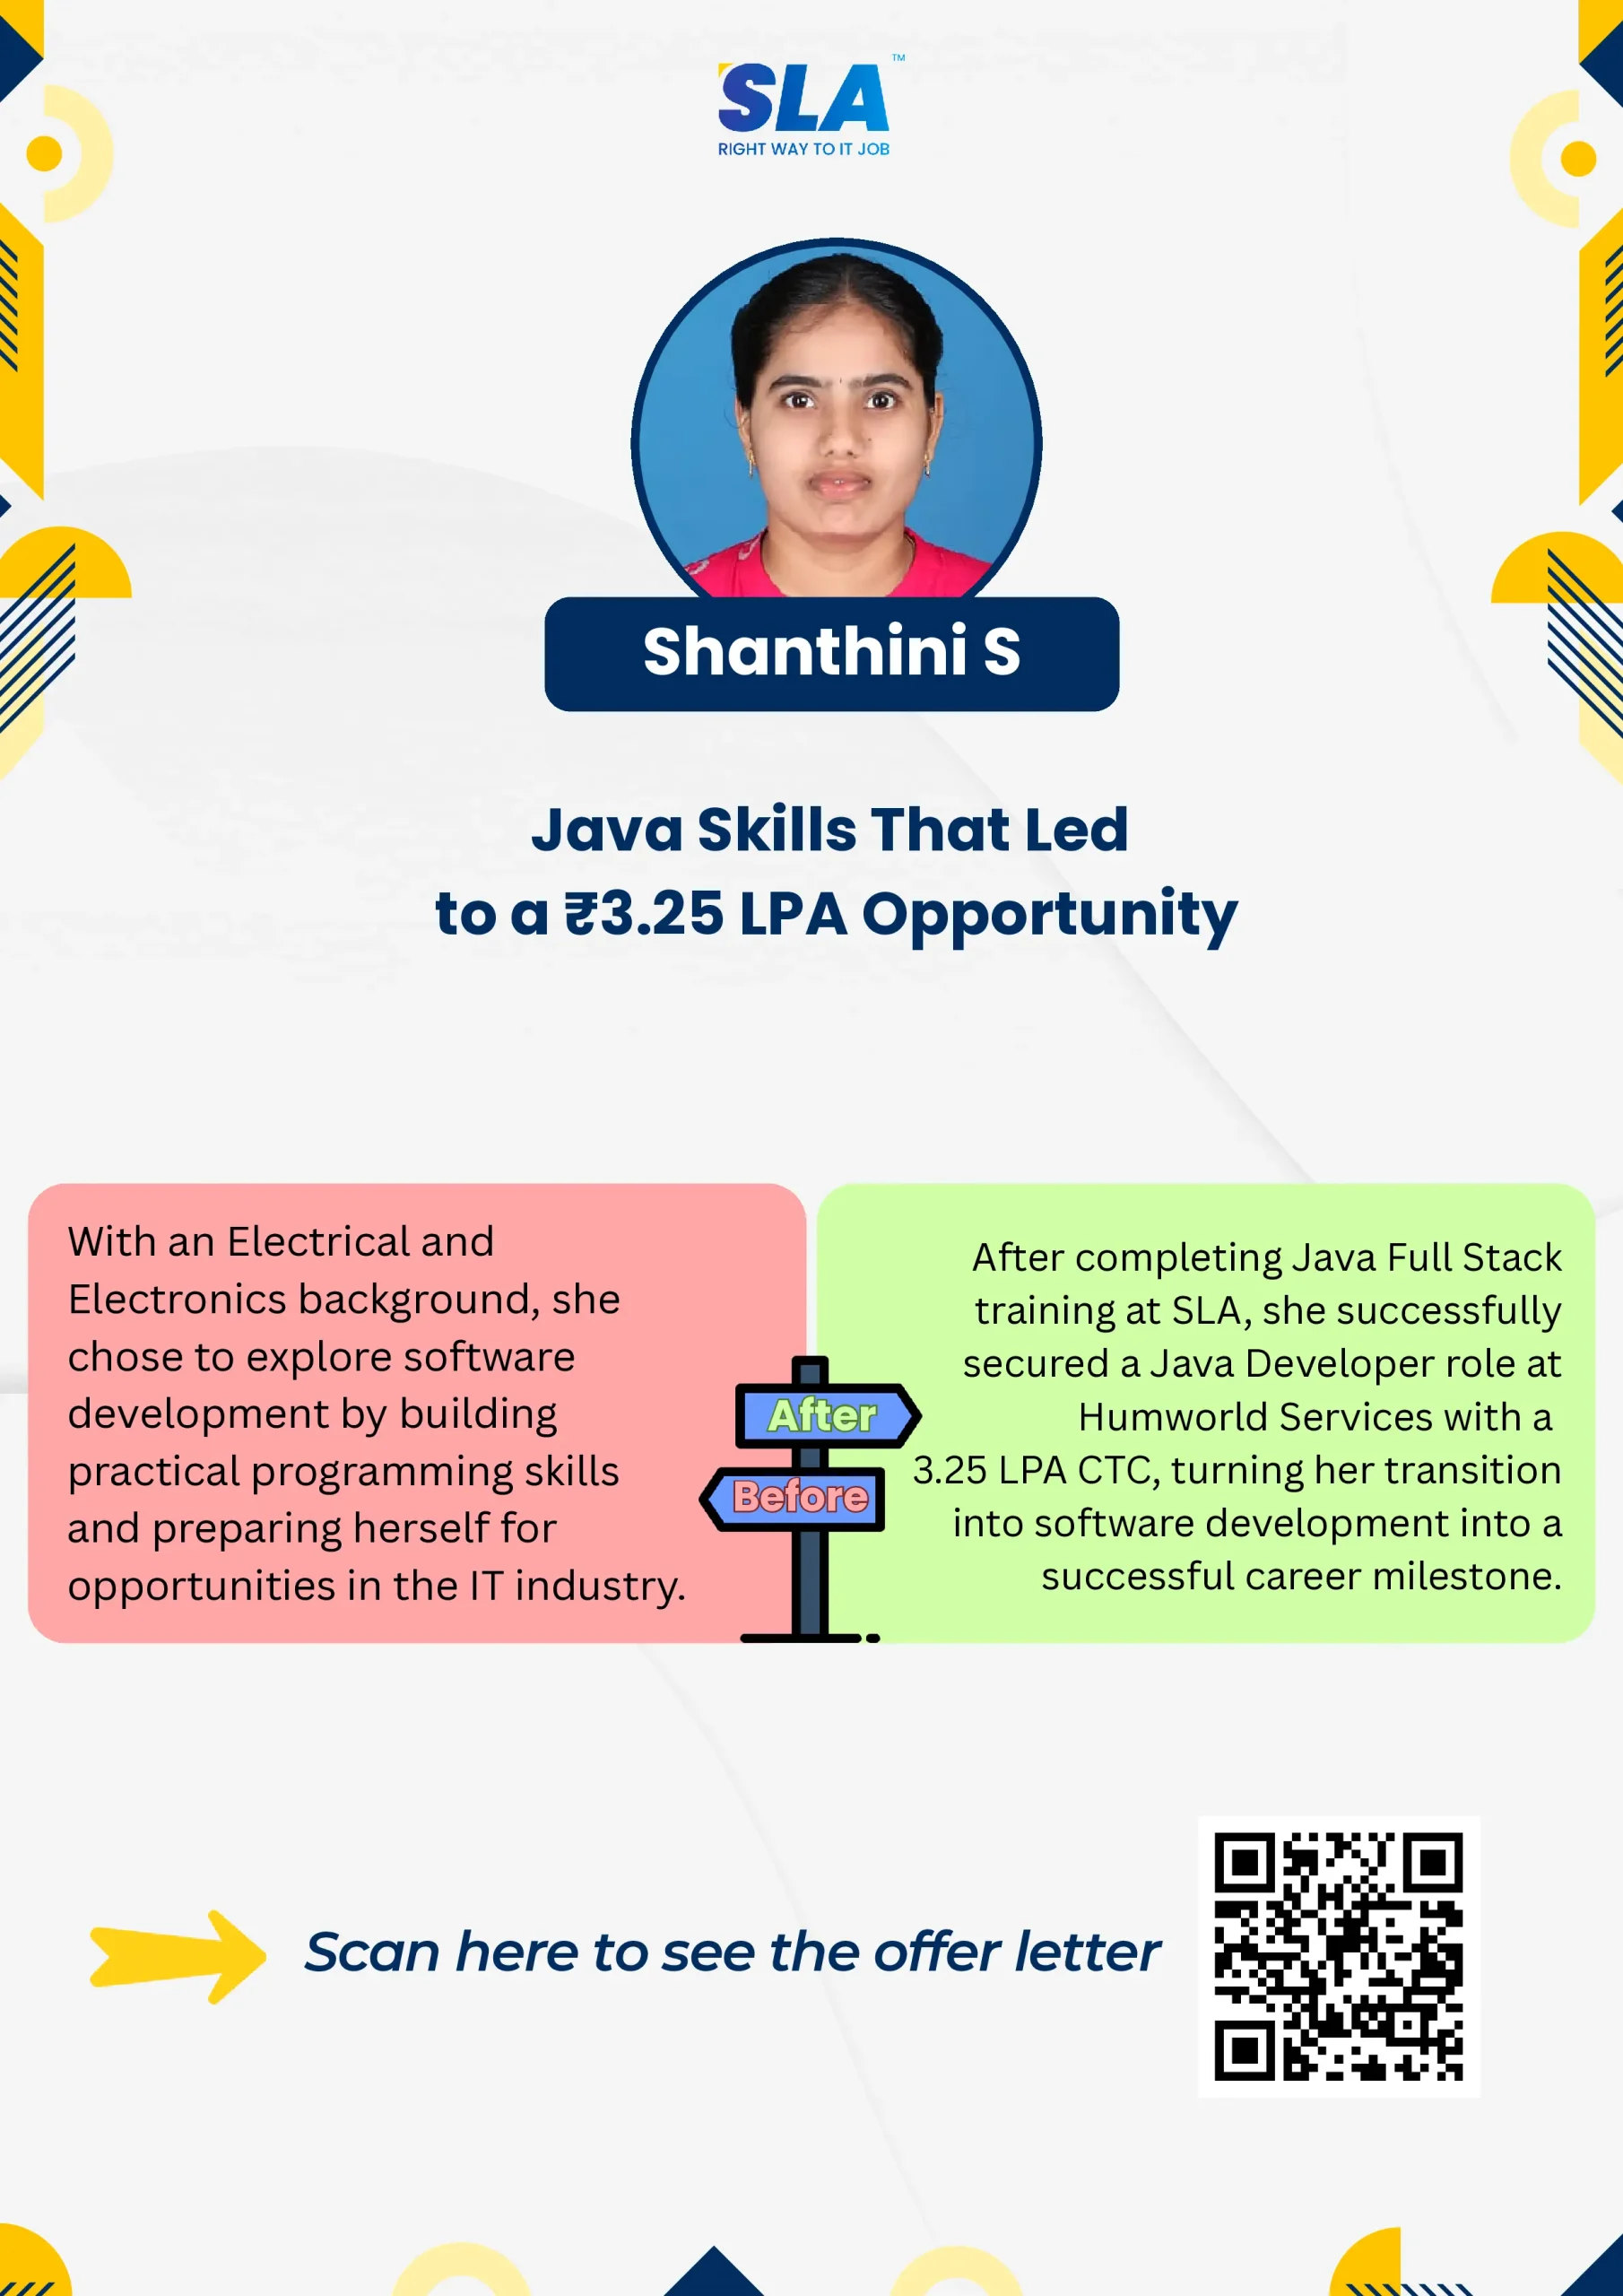
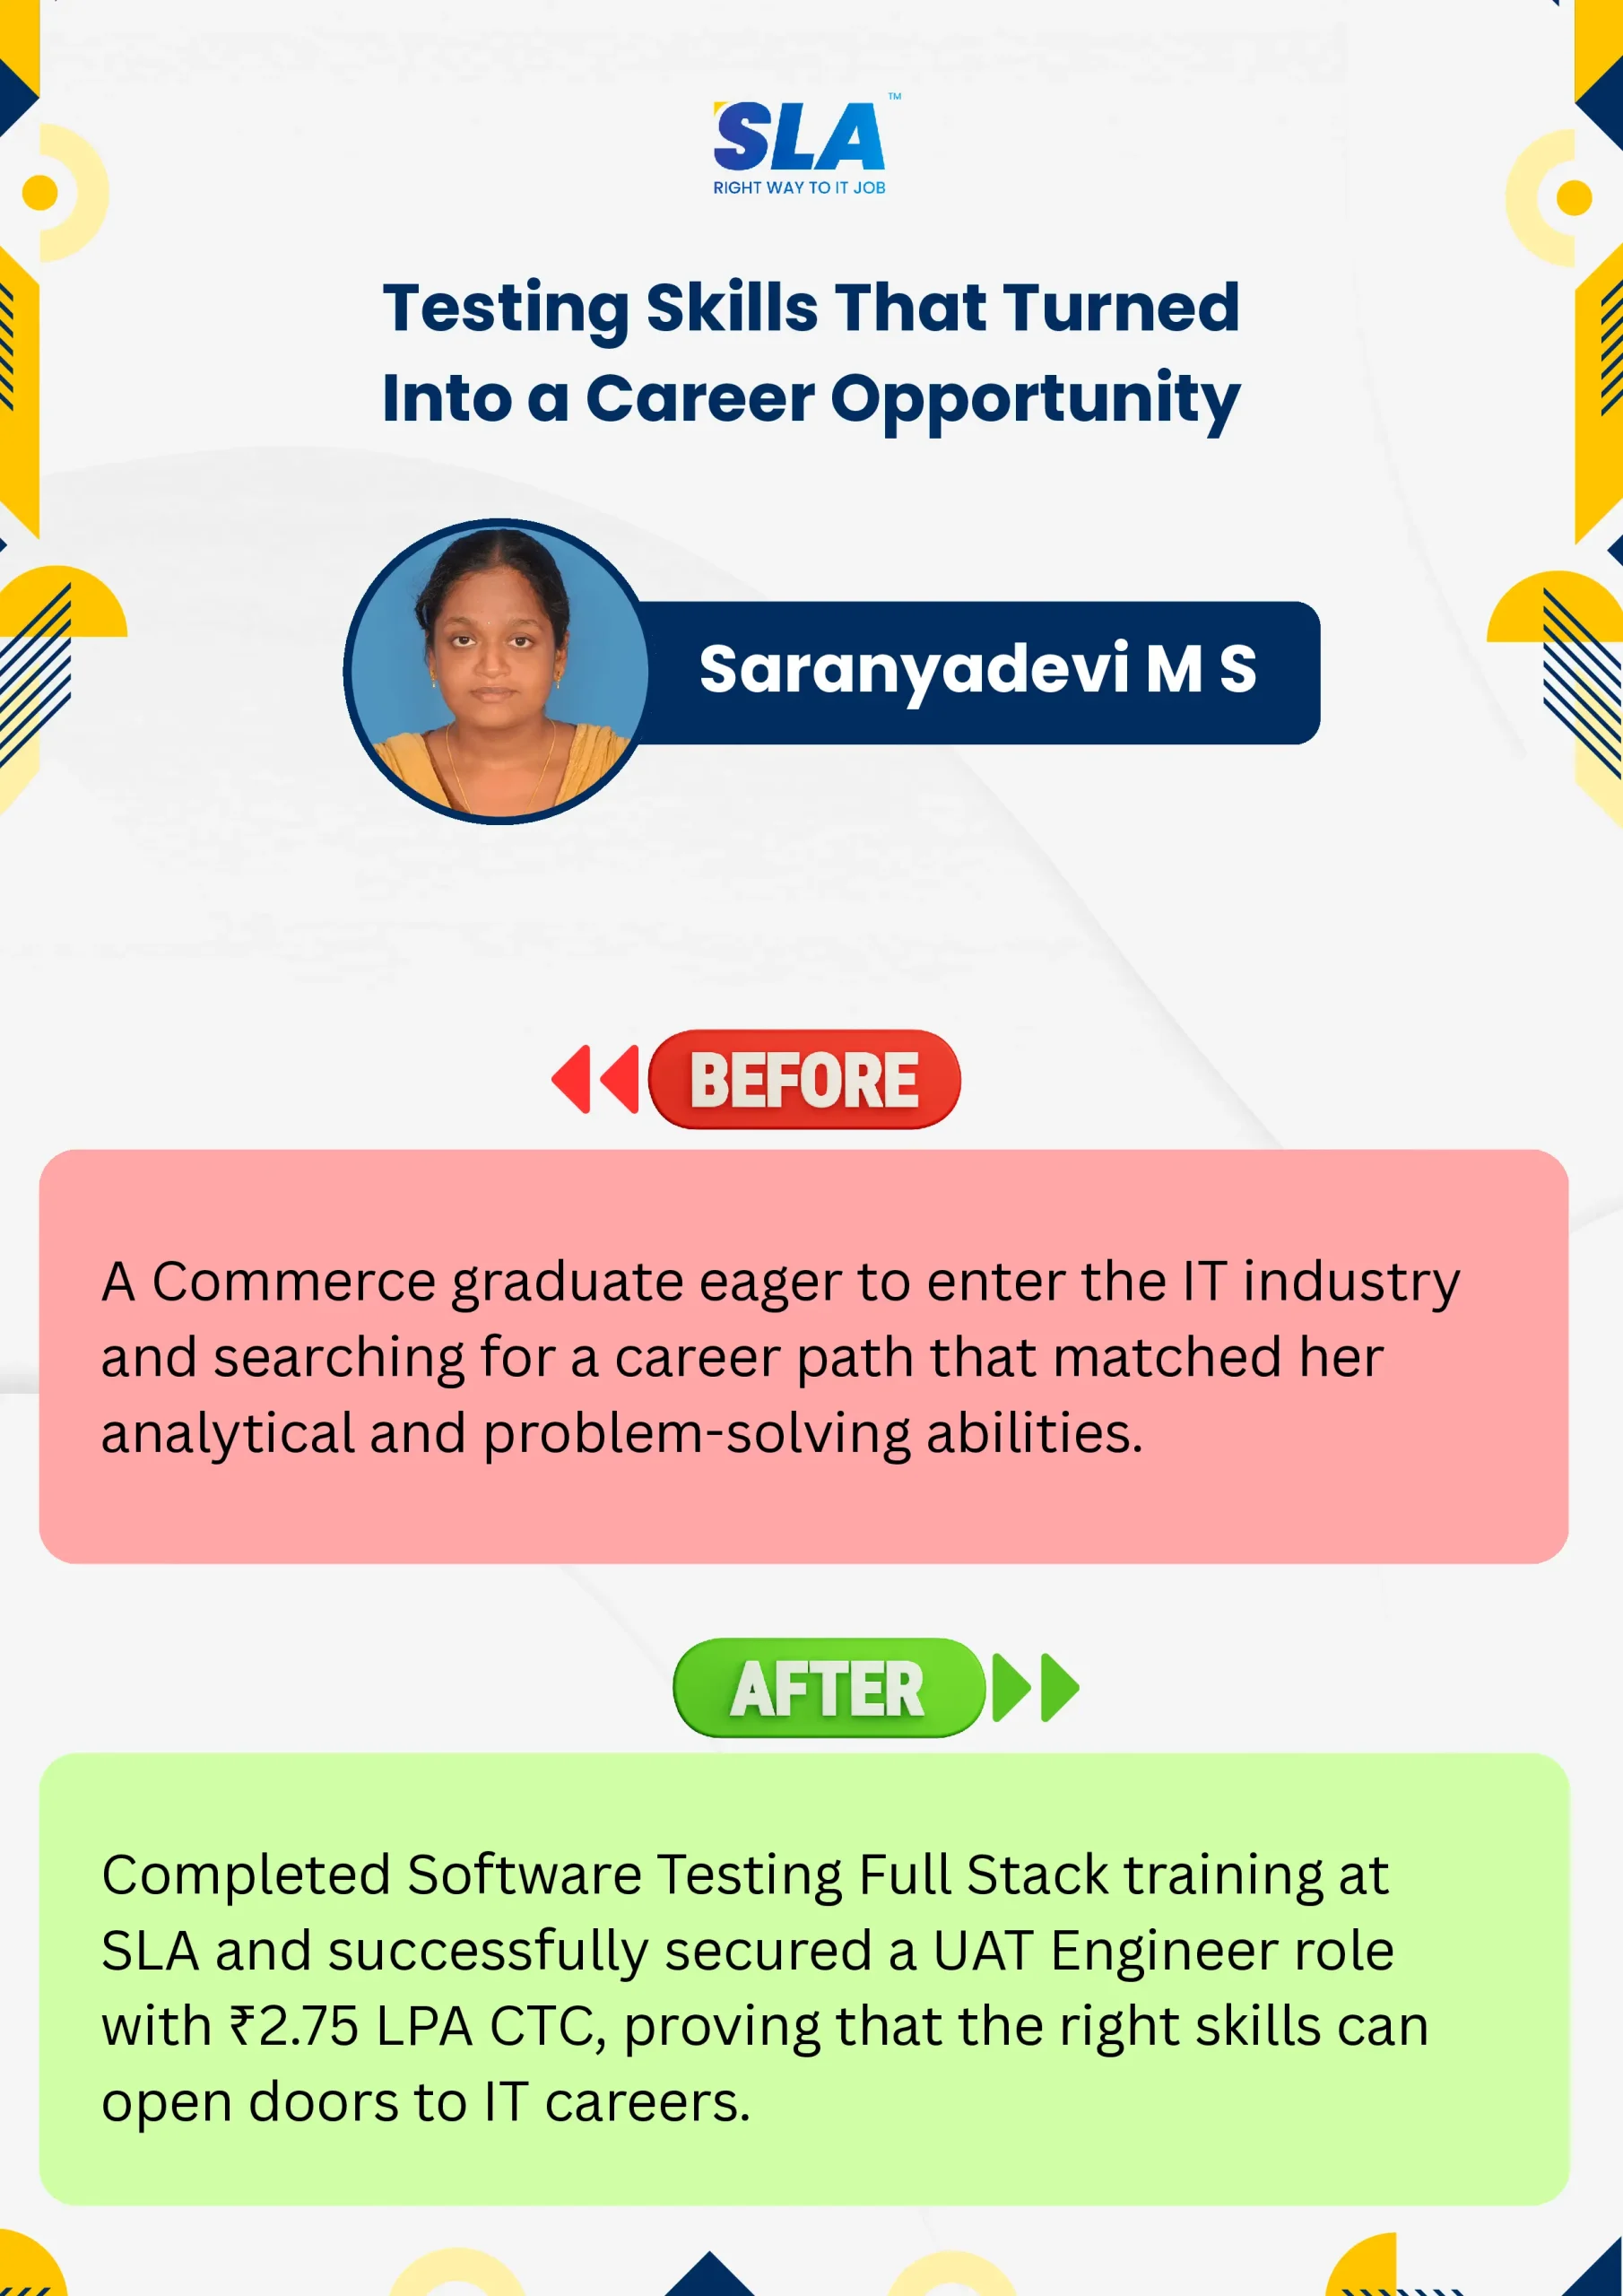
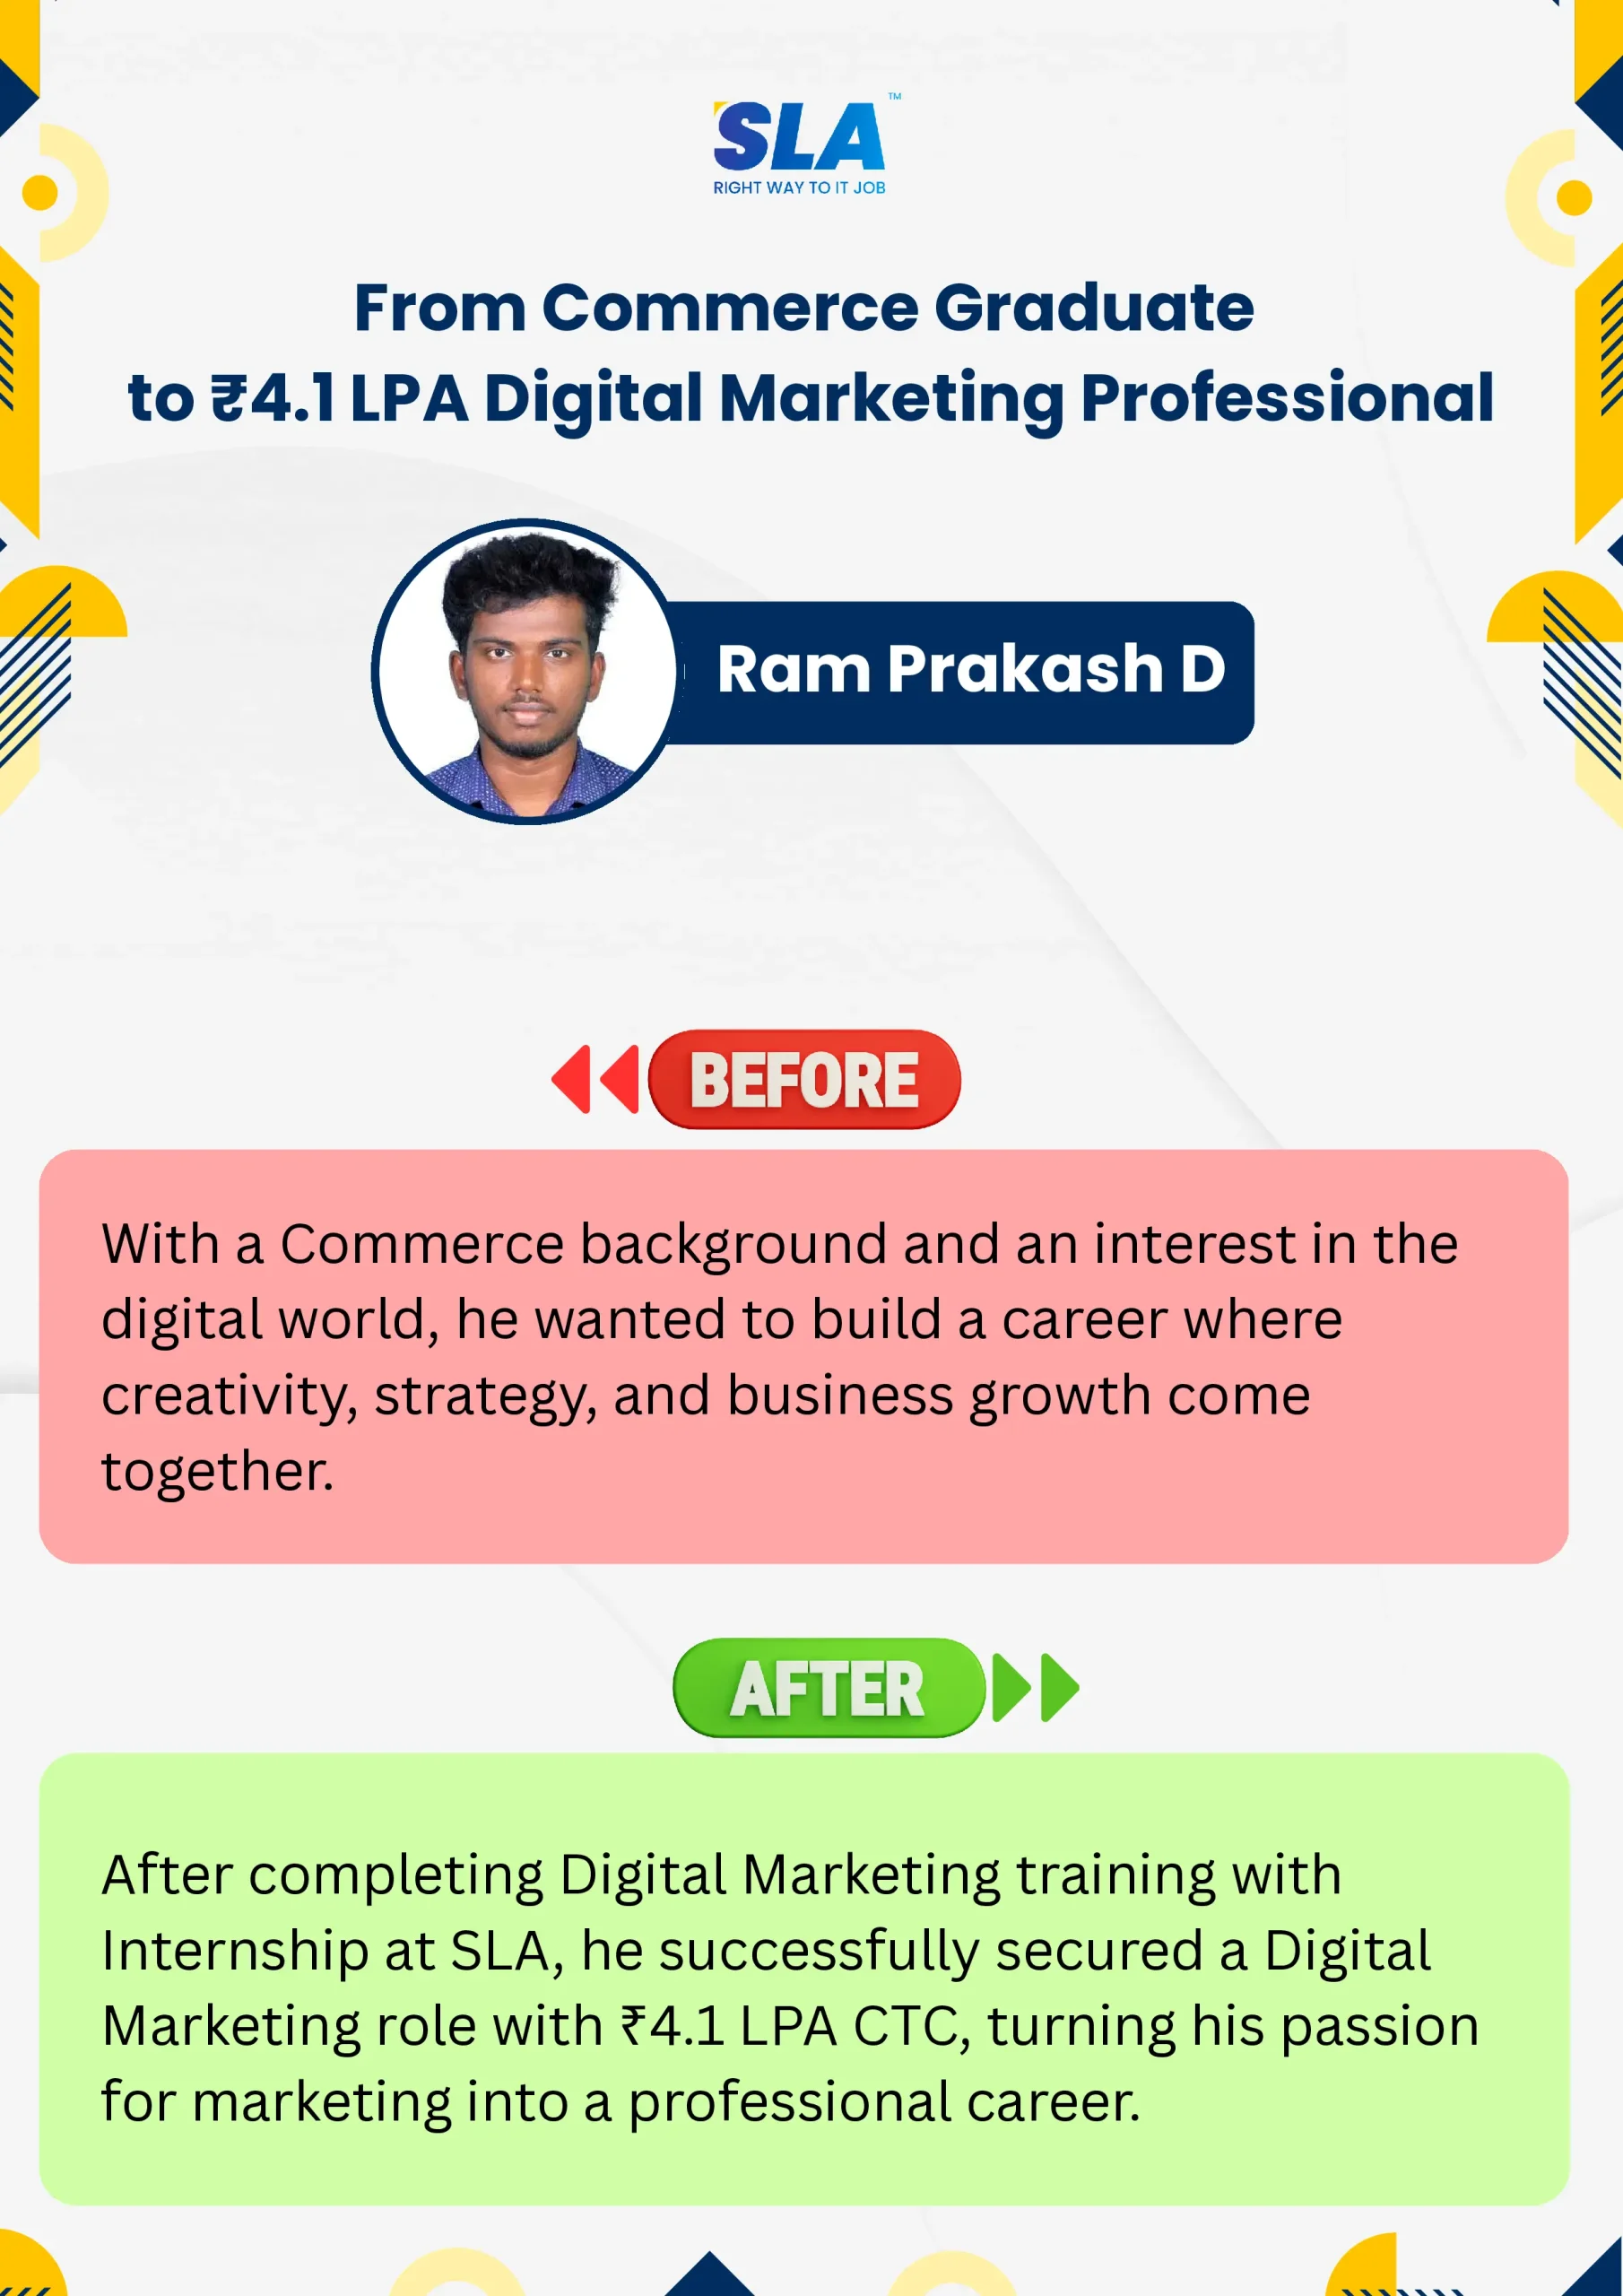
Google Reviews

Rating
4.8
1,053 Google reviews

Shaaru Menan
I had a 3 year career break. Joined SLA on Java Full Stack course and completed it.Did projects with the help of my Mentor. They…

Click here for Full Review

SARAN M
SLA Institute provides training in communication and aptitude along with strong technical skills. The trainers explain concepts clearly with a practical approach, which helps build…
Click here for Full Review

NalluKumar Ravichandran
Hi, I recently completed the DOT NET Full Stack Development course at SLA, and I had a great learning experience. The teaching style and student…
Click here for Full Review

Nithish Sahoo
I had an excellent experience taking this DevOps course. The curriculum is well-structured and covers both fundamental and advanced DevOps concepts in a clear manner.…
Click here for Full Review

MATHAN KUMAR G EEE
SLA Institute provides a structured learning environment for data analytics. The syllabus is relevant, and trainers are knowledgeable. Some sessions were very useful practically, while…
Click here for Full Review

Surya
Special thanks to Vishal Sir, the Placement Officer, for his interview guidance, resume support, and continuous motivation throughout the placement process. I would also like…
Click here for Full Review