
Softlogic is one of the Top Training institutes for Tableau. Learn how to use Tableau, from beginner basics to advanced techniques. Our Tableau Syllabus Covers the Tableau Desktop, data connections, calculated fields, dashboards, storytelling, data blending, and report sharing. We offer an Tableau Course with Placement Assistance, Mock interviews, Resume building, and certification.
Tableau Developer Course
4.80
(3024)
DURATION

1 Month
EMI

0% Interest
Mode

Live Online / Offline

Let's take the first step to becoming an expert in Tableau
Click Here to Get Started
Lifelong Placement
Assistance
Get Certified
JOB PLACEMENT ELIGIBILITY TEST
×
Your Placement Eligibility Report
Want more details about Tableau?
Fill out the form, and our counsellors will get in touch with you at your preferred time. You can have all your queries answered. Once you decide that SLA is the perfect fit for your training needs, our counselors will guide you through the process every step of the way.

Course Schedules

Course Syllabus

Course Fees

or any other questions...
Fees, Duration & Batch Timings for Tableau
Hands On Training
3-5 Real Time Projects
60-100 Practical Assignments
3+ Assessments / Mock Interviews
July 2026
Week days
(Mon-Fri)
Online/Offline
2 Hours Real Time Interactive Technical Training
1 Hour Aptitude
1 Hour Communication & Soft Skills
(Suitable for Fresh Jobseekers / Non IT to IT transition)
Course Fee
July 2026
Week ends
(Sat-Sun)
Online/Offline
4 Hours Real Time Interactive Technical Training
(Suitable for working IT Professionals)
Course Fee
Save up to 20% in your Course Fee on our Job Seeker Course Series
Learn More
Syllabus of Tableau
Download Syllabus
Data warehousing Concepts
- What is DWH?
- Characteristics of Datawarehouse
- Difference between OLTP and DWH
- Architecture of DWH
- Various BI tools
- Types of DWH
- Types of Dimensional Data Modeling
- Surrogate key
- Types of Dimension
Business Intelligence Concepts
- BI application types (ad hoc, standard reporting, analytic applications, dashboards) and audiences
- Specification of templates, applications and navigation framework
- Development of applications and BI portal
Tableau Desktop (Introduction)
- Introduction Tableau
- Connecting to Excel, CSV Text Files
- Getting Started
- Product Overview
- Connecting to Databases
- Working with Data
- Analyzing
- Formatting
- Introduction to Calculations
- Dashboard Development
- Sharing
- Data Calculations
- Aggregate Calculations
- User Calculations
- Table Calculations
- Logical Calculations
- String Calculations
- Number Calculations
- Type Conversion
- Parameters
- Filtering Conditions
- Filtering Measures
- Histograms
- Sorting
- Grouping
- Sets
- Tree maps, word clouds and bubble charts
- Pareto Charts
- Waterfall Charts
- Bump Charts
- Funnel Charts
- Bollinger Bands
Tableau Server
- Install Configuration
- Tab admin
- Tab cmd
- Data Server
- End User Training
- JavaScript API Intro and Embed
- JavaScript API Switching Views
- JavaScript API Filtering and Selecting
- JavaScript API Asynchronous Programming
- JavaScript API Event Listeners
- JavaScript API Advanced Filtering
- JavaScript API Utility Function
Tableau Advanced
- Authoring for Interactivity
- Data Blending
- Basic Mapping
- Advanced Mapping Techniques
- WMS Servers
- Polygon Maps
- Background Images
- Custom Geo coding
- Cubes
- Trend Lines, Residuals, and Forecasting
- Statistics Calculations
- Ben ford’s Law
- Box Plots
- Sales force
- Google Analytics
- Extract API CSV to TDE
- Connecting to Web-based Data Sources with the Extract API
- Extract API Transforming Your Data
- Analyzing Sales Data with Tableau
- Tableau Online Security and Administration
- Tableau Online Security and Administration
- Tableau Online Updating Data to the Cloud
Tableau Visual Analytics Training
- Introduction
- Laying the Groundwork for Visual Analysis
- Getting, Cleaning and Classifying Your Data
- Visual Mapping Techniques
- Solving Real-World Problems
- Communicating Your Findings
Objectives of Tableau
The objectives of learning the Tableau course are,
- Learn how to establish connections with and modify data sources.
- Learn how to link, extract, and change information to prepare data.
- Discover how to use the Tableau workspace to build dashboards, stories, and visualizations.
- Develop your ability to create charts for analysis and to sort, filter, and compare data subsets.
- Understand how to use performance optimization to expedite the handling of big data.
Request a Free Callback
Why Softlogic Systems is the Best Choice for Tableau – Learn, Practice, and Get Placed!

Online & Offline Training Options
Learn at your convenience with flexible classroom and live online training.

Learn from 100+ Real-Time Developers
Get trained by industry professionals with years of hands-on experience.

Hands-on Projects & Codeathons
Practice with real-time projects and coding challenges to build confidence.
0% EMI Fee Options
Pay your course fees flexibly with easy EMI plans at zero interest.

Resume & Interview Support
Get expert help with resume building, mock interviews, and soft skills.

Placement with Top IT Firms
Access placement opportunities with leading MNCs and IT companies.

1000+ Hiring Partners
Benefit from Softlogic’s strong recruiter network for faster job placement.

No Backdoor Jobs
We ensure only genuine placement opportunities with trusted companies.
Request a Free Callback
Highlights of Tableau
What is the Tableau?
Tableau is a platform for visual analytics that assists individuals and groups in using data to solve issues. The user is prioritized in the design of Tableau’s products, which are strong, versatile, and safe.
What are the reasons for learning Tableau?
Here are some reasons to learn Tableau:
- The data integration process is streamlined with Tableau’s assistance.
- There are jobs available in almost every industry.
- Tableau specialists are in great demand, which translates into excellent compensation.
- Possessing Tableau expertise will help you get employment in prestigious companies.
What are the prerequisites for learning Tableau?
Few requirements apply to our Best Tableau Training, so a wide range of learners can benefit from it.
- Basic understanding of data analysis and visualization concepts.
- Familiar with Microsoft Excel.
Our Tableau course is suitable for:
- Students
- Professionals seeking a career change
- IT professionals aiming to enhance their skills
- Enthusiastic programmers
- Job Seekers
What are the course fees and duration?
Our Tableau training cost ranges from ₹25,000 based on the course level (basic, intermediate, or advanced) and format (online or in person). Generally, the Tableau course duration is approximately 1-2 months and includes certification upon completion. For accurate details concerning fees, duration, and certification, we suggest reaching out to our Tableau training institute directly.
What are some job roles related to Tableau?
Following completion of training at our top-rated Tableau Training Center, candidates can pursue a variety of careers that make use of their expertise in data analysis and visualization. Several of these positions consist of:
- Business Intelligence (BI) Developer
- Data Analyst
- Data Visualization Specialist
- Data Engineer
- Quality Assurance Analyst
- Operations Analyst
What is the salary range for a Tableau professional?
The average salary for a fresher Java Tableau developer with less than 3 years of experience is ₹3.4 lakhs. The average yearly salary for a Java Tableau developer in their mid-career who has 4 to 9 years of experience is ₹7.9 lakhs. An experienced Java developer’s salary is between ₹11.0 lakhs and ₹15.0 lakhs annually.
List a few Tableau real-time applications.
Real-time applications for Tableau are used in many different industries, such as:
- Data-driven decision-making.
- Analyzing sales data and customer behavior.
- Quality control and monitoring production.
- Monitor revenue management, occupancy rates, and guest satisfaction.
- Threat tracking for improved security protocols.
- Analyzing consumer preferences.
- Explore market trends.
Boost Your Skills with Our Tableau Experts
Our Mentors are from Top Companies like:
- With over 10 years of experience in the field of data processing, data visualization, data analytics, and business intelligence, our trainers are Tableau Certified Professionals.
- They are top-notch educators with a focus on teaching you Tableau swiftly and practically.
- They have great proficiency working with intricate Tableau ETL operations and are adept at recognizing and classifying data patterns.
- They have expertise in creating reports, data insights, visualizations, and Tableau dashboards.
- They have a strong background in designing and implementing Tableau dashboards for the web, and they are skilled in producing personalized visuals.
- They have deep proficiency with Tableau Desktop, Tableau Prep, and Tableau Server and are very aware of Tableau database connection techniques.
- They have exciting experience in training and mentoring, debugging Tableau issues, and best practices of teaching for using Tableau, having mentored over 5000 students.
Request a Free Callback
What Modes of Training are available for Tableau?
Offline / Classroom Training

A Personalized Learning Experience with Direct Trainer Engagement!
- Direct Interaction with the Trainer
- Clarify doubts then and there
- Airconditioned Premium Classrooms and Lab with all amenities
- Codeathon Practices
- Direct Aptitude Training
- Live Interview Skills Training
- Direct Panel Mock Interviews
- Campus Drives
- 100% Placement Support
Online Training

Instructor Led Live Training! Learn at the comfort of your home
- No Recorded Sessions
- Live Virtual Interaction with the Trainer
- Clarify doubts then and there virtually
- Live Virtual Interview Skills Training
- Live Virtual Aptitude Training
- Online Panel Mock Interviews
- 100% Placement Support
Corporate Training

Blended Delivery model (both Online and Offline as per Clients’ requirement)
- Industry endorsed Skilled Faculties
- Flexible Pricing Options
- Customized Syllabus
- 12X6 Assistance and Support
GET Free Consultation
Certifications
Take your career to new heights with Softlogic's software training certifications.
Improve your abilities to get access to rewarding possibilities
Improve your abilities to get access to rewarding possibilities

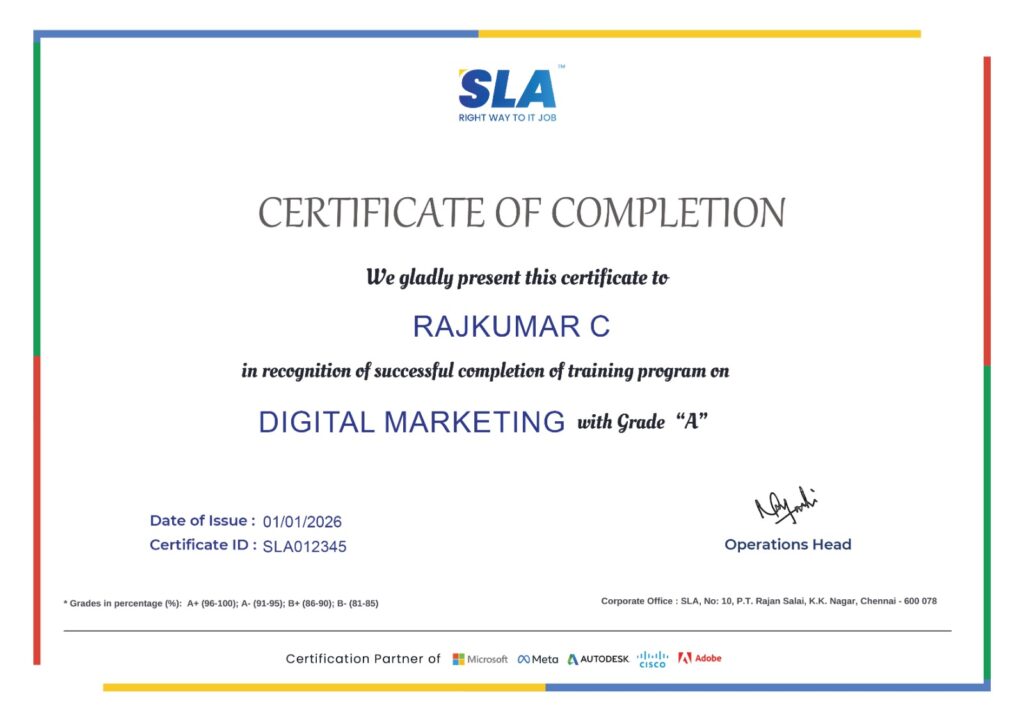
Earn Your Certificate of Completion
Validate your achievements with Softlogic's Certificate of Completion, verifying successful fulfillment of all essential components.
Take Your Career to the Next Level with Certifications
Get a certifications through our training programs to gain a competitive edge in the industry.

Stand Out from the Crowd with Codethon Certificate
Verify the authenticity of your real-time projects with Softlogic's Codethon certificate.

Hands-on Project Practices in Tableau
Analytics for Real Estate Business
Dashboard for Finances
Dashboard for Risk Management
Analysis of Environmental Data
Analysis of E-commerce
Analysis of Event Attendance
Analysis of Sales Territory
Management of Project Portfolios
Analytics for HR
The SLA Way to Get Placed in Top IT Companies
Enrollment

Technology Training
Coding Practices
Realtime Projects
Realtime Projects
Placement Training
Aptitude Training
Interview Skills
Interview Skills
Panel Mock
Interview

Unlimited
Interviews

Interview
Feedback

100%
IT Career
Placement Support for a Tableau Job
Genuine Placements. No Backdoor Jobs at Softlogic Systems.

Aptitude Training
from Day 1
Interview Skills
from Day 1

Softskills Training
from Day 1
Build Your Resume

Build your LinkedIn Profile

Build your GitHub
digital portfolio

Panel Mock Interview
Unlimited Interviews until you get placed

Life Long Placement Support at no cost
Request a Free Callback
FAQs
What is Tableau used for?
With its collaborative data visualization capabilities, Tableau is a software supplier that assists companies that use business information analytics. By displaying data and emphasizing trends for business intelligence analysis, Tableau helps businesses make data easier to understand.
What is Tableau for beginners?
In recent years, Tableau, a potent and user-friendly data visualization tool, has become incredibly popular. It is a valuable tool for company reporting and analysis.
Does Tableau require coding?
Tableau does not require typical computer programming or coding. On the other hand, doing bespoke computations could seem like code, and connecting to data can be done with SQL code.
Why is Tableau needed?
Tableau facilitates the conversion of information into action, reduces the duration of analysis, and modifies habits to encourage a more data-driven culture throughout the company.
Is Tableau an IT skill?
Yes With interactive dashboards, reports, and charts, Tableau Desktop is a business intelligence solution that assists with data analysis and visualization. However, it is made to make connecting to and visualizing data from several sources simple for non-technical users.
Is Tableau enough to get a job?
There are many main advantages to pursuing a career in Tableau: There are plenty of long-term prospects guaranteed by persistent demand across all sectors. Professionals should anticipate significant advancement and development in their careers.
How long does it take to learn Tableau for a beginner?
It may take 2 to 3 months, with the right commitment and training needed for Tableau expertise.
What certification will I receive after finishing the Tableau course?
You will receive internationally recognized SLA course completion certificates for the Tableau course upon conclusion of the training, in addition to prestigious IBM credentials and Codeathon certificates attesting to your proficiency with real-world projects.
What happens if I miss a Tableau course session?
SLA trainers promise that not a single Tableau training class will be missed. We will assign substitute Tableau classes to those who missed the classes and gave advance notice.
I still have some questions about joining the Tableau course at SLA.
Kindly contact our Tableau course advisor via WhatsApp or at +91 86818 84318. As an alternative, you can contact us by chat on our website, email enquiry@softlogicsys.in, or through our contact form.
Additional Information for
the Tableau
Future Prospects of Tableau
Yes, given the increasing emphasis on data-driven decision-making across a range of businesses, Tableau developers are in great demand. Tableau expertise is widely sought after by companies, as they need individuals who can interpret complex data into useful insights.
Important Tableau Features
Tableau is an extensive feature-rich data visualization application that includes:
- Interactivity.
- Scalability.
- Integration.
- Drag-and-drop interface.
- In-memory analytics.
- Advanced visualization capabilities.
- Real-time analytics.
- Intuitive dashboard creation.
- Role-based permissions.
- Simple sharing and collaboration.
- Mobile accessibility.
- Natural language querying.
Tableau Certification Value
You can apply for jobs as a data analyst, business intelligence analyst, business analyst, and data-driven industries that need strong analytical and visualization skills after earning a Tableau certification.
Related Blogs
Challenges in Tableau for Beginners
Published On: November 5, 2024
Introduction Tableau is a powerful data visualization and business intelligence platform that allows users to…
Tableau Project Ideas
Published On: October 24, 2024
Introduction Are you looking for ways to improve your data visualization skills and build a…
Tableau Developer Salary For Freshers and Experienced
Published On: October 12, 2024
Introduction Tableau plays a major role in business reporting and decision making across industries. Companies…
Tableau Tutorial for Beginners
Published On: October 9, 2024
Introduction Have huge Excel files that make your head spin, or meaningful, interactive charts that…
Tableau Interview Questions and Answers
Published On: January 25, 2022
Introduction When it comes to data visualization, Tableau is the most powerful software in that…


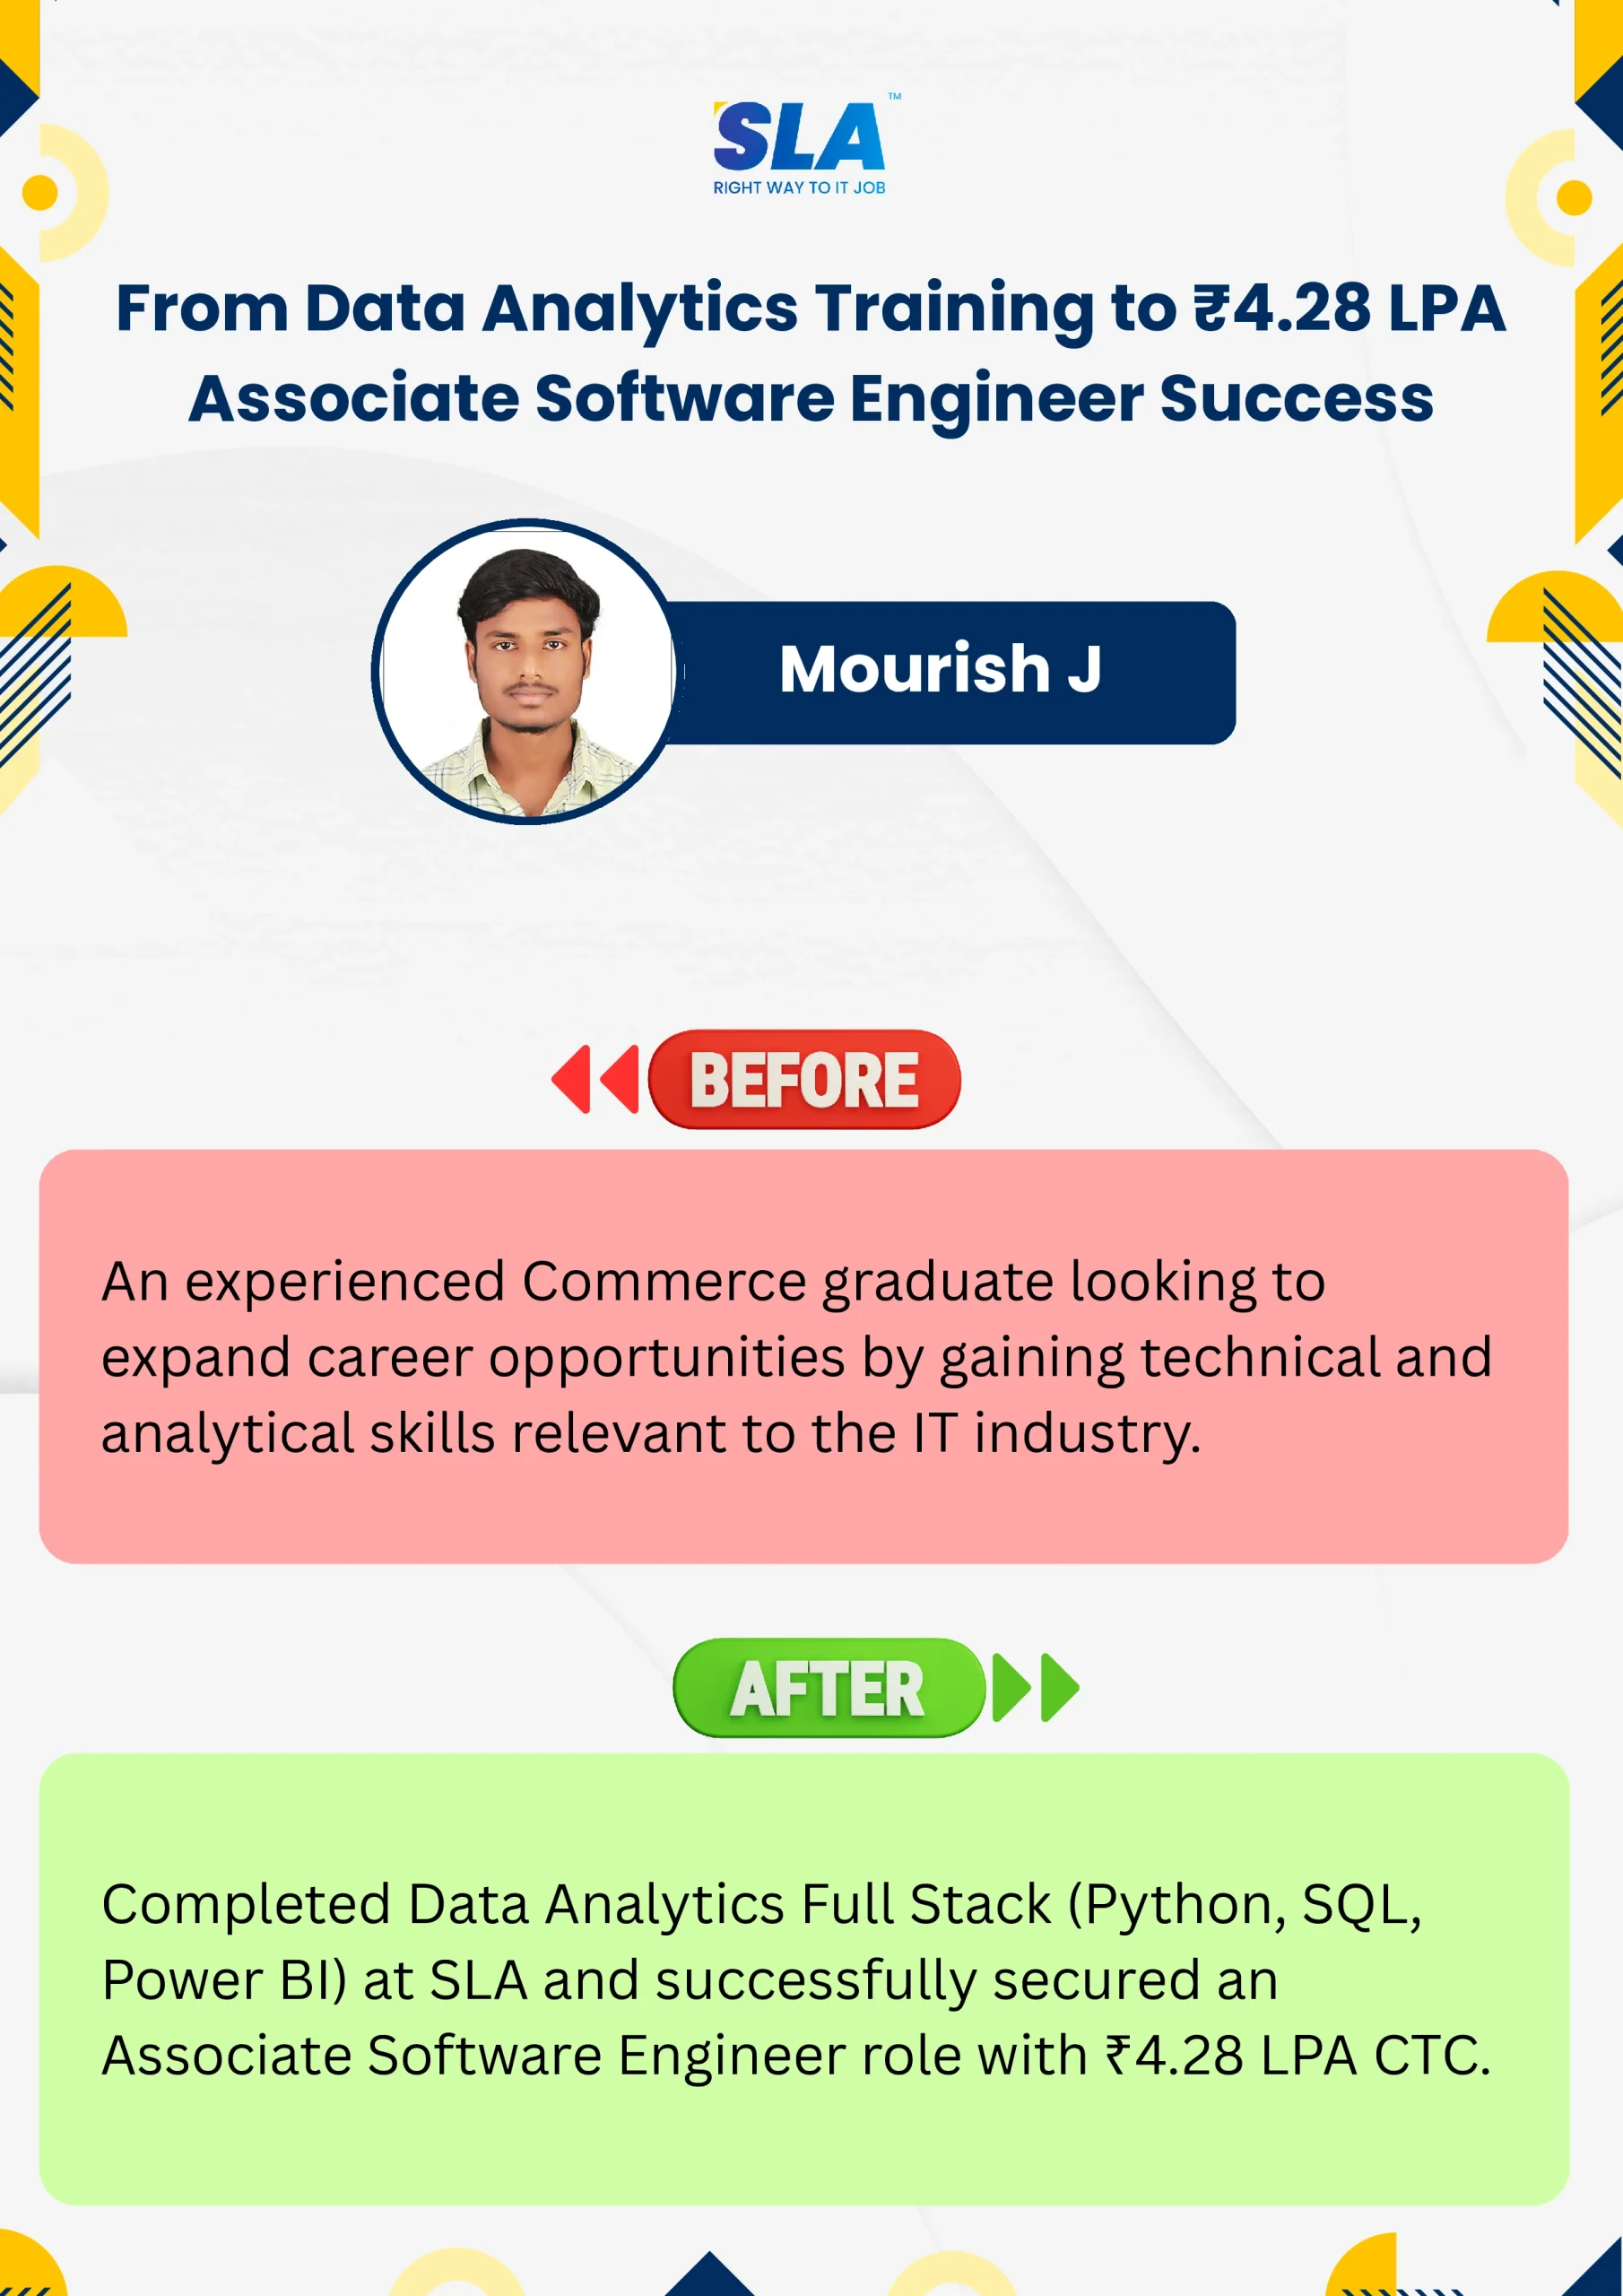
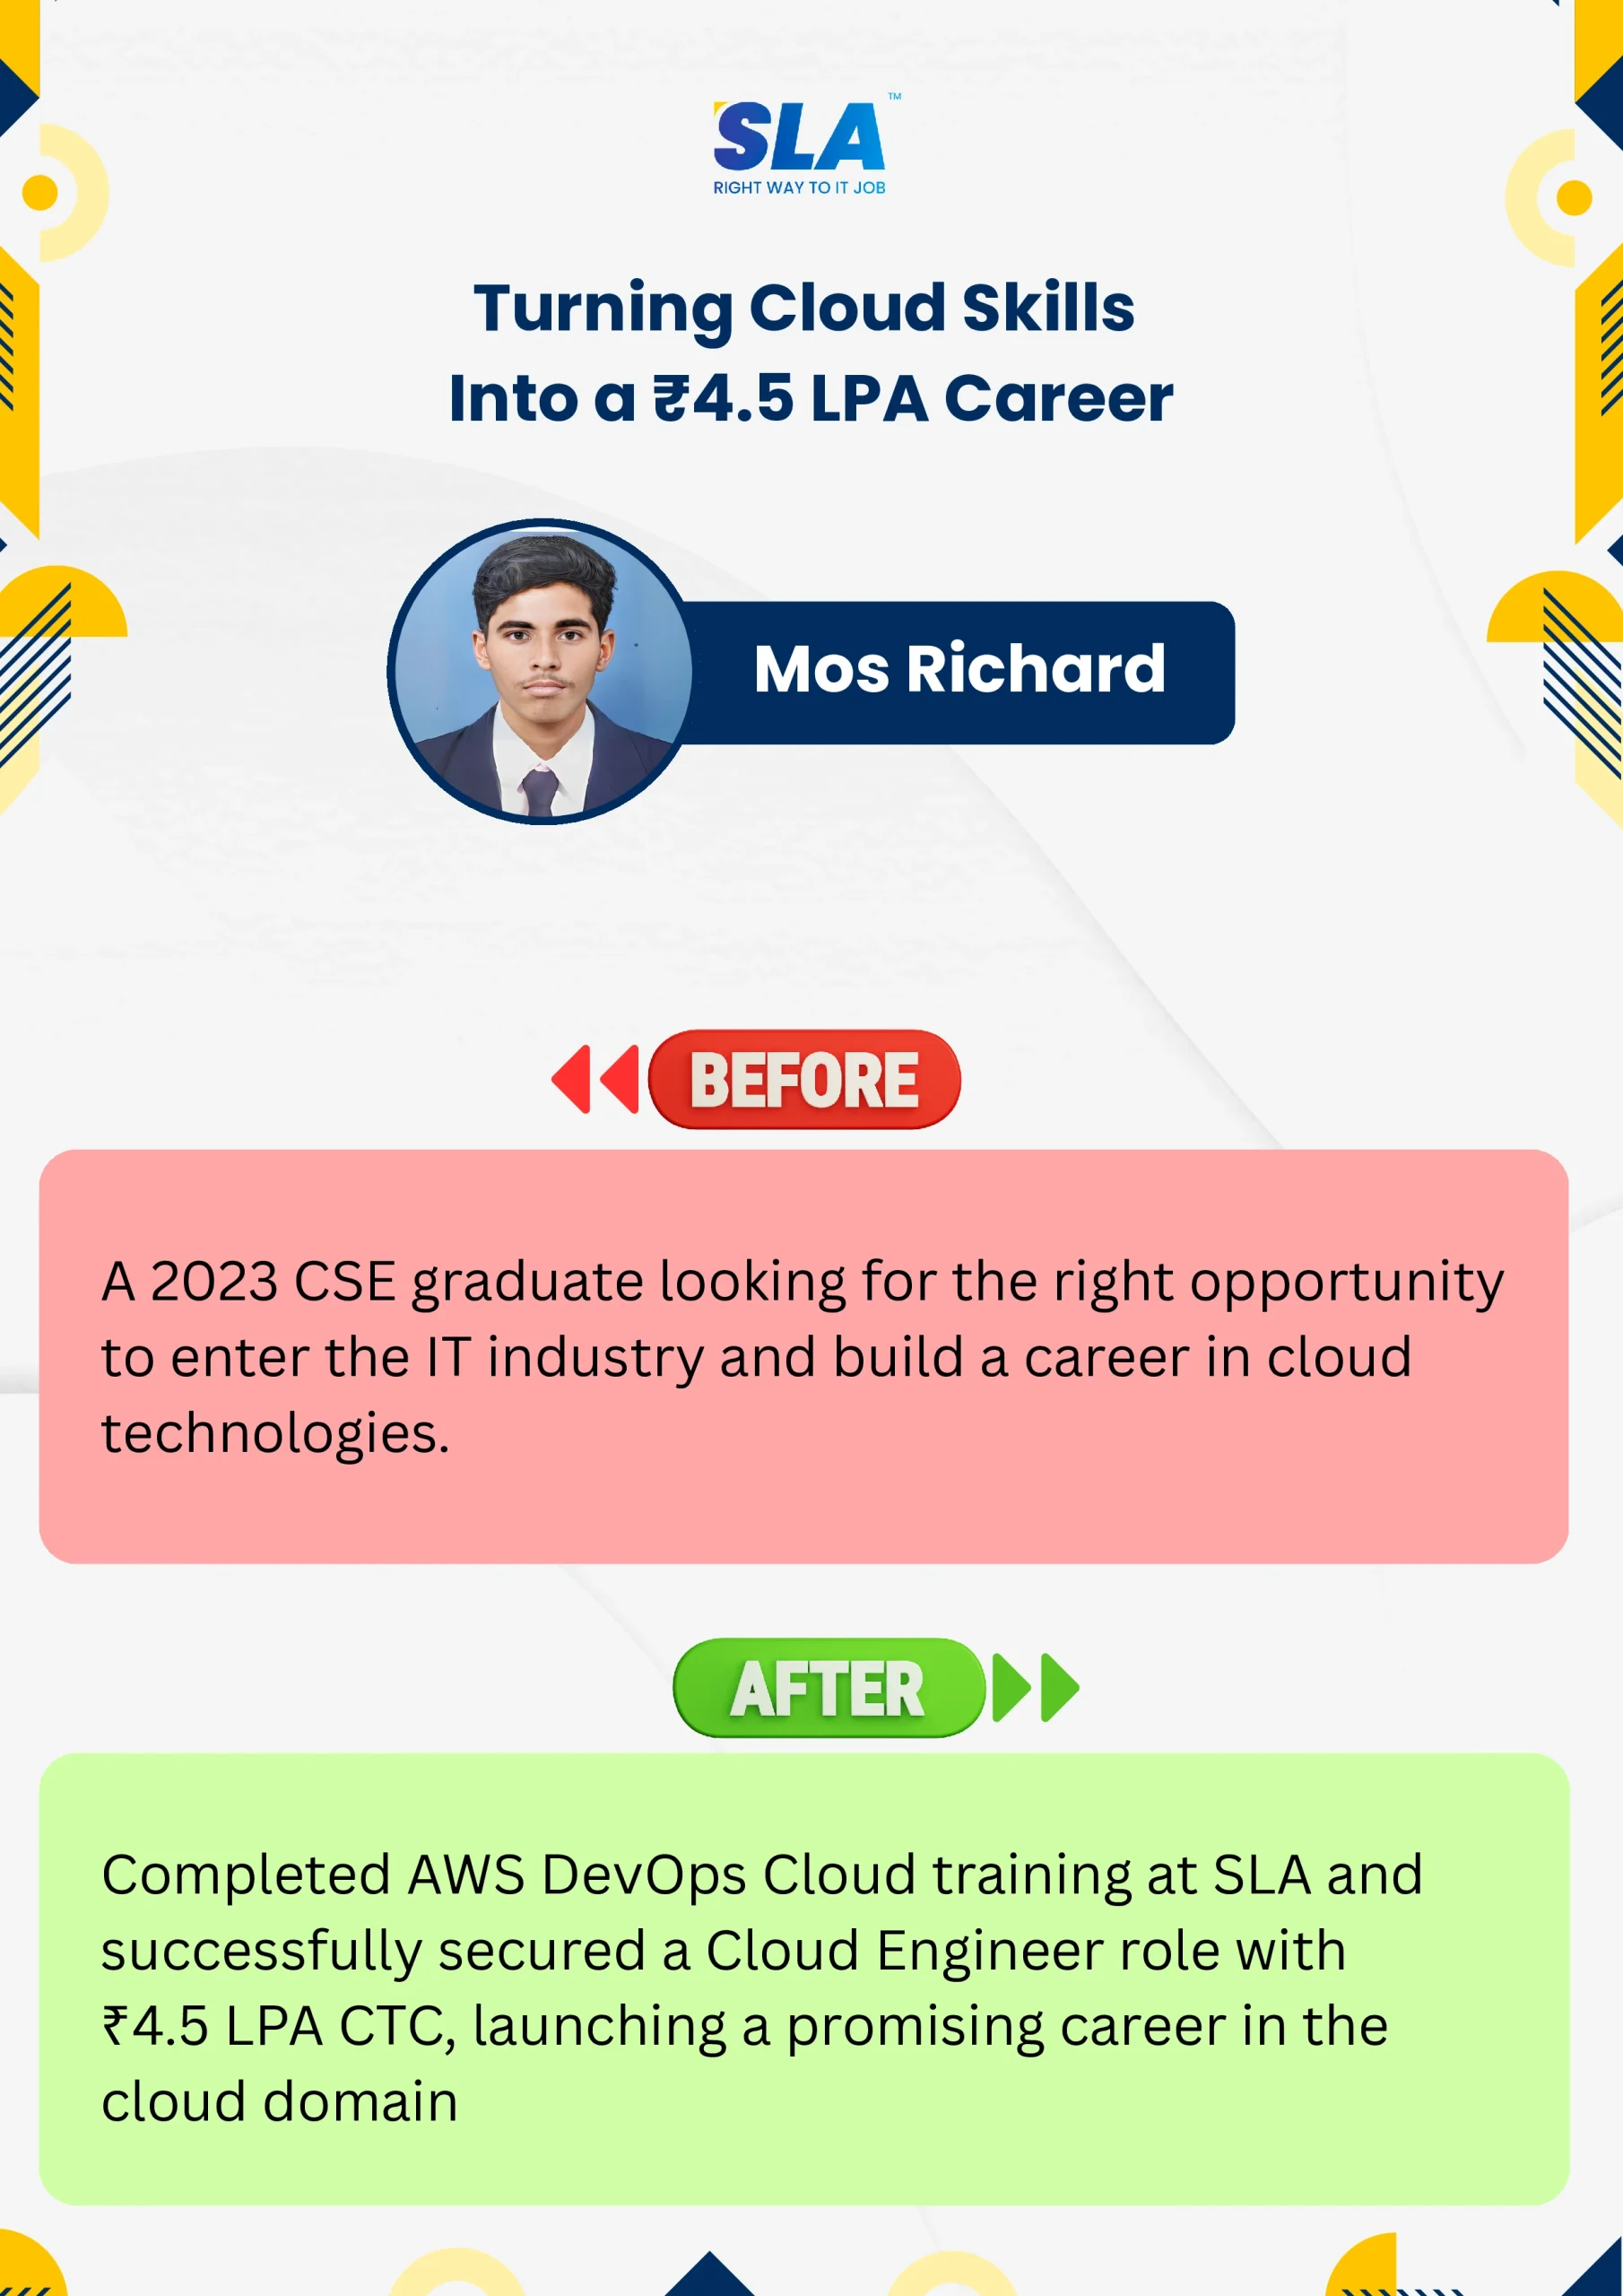
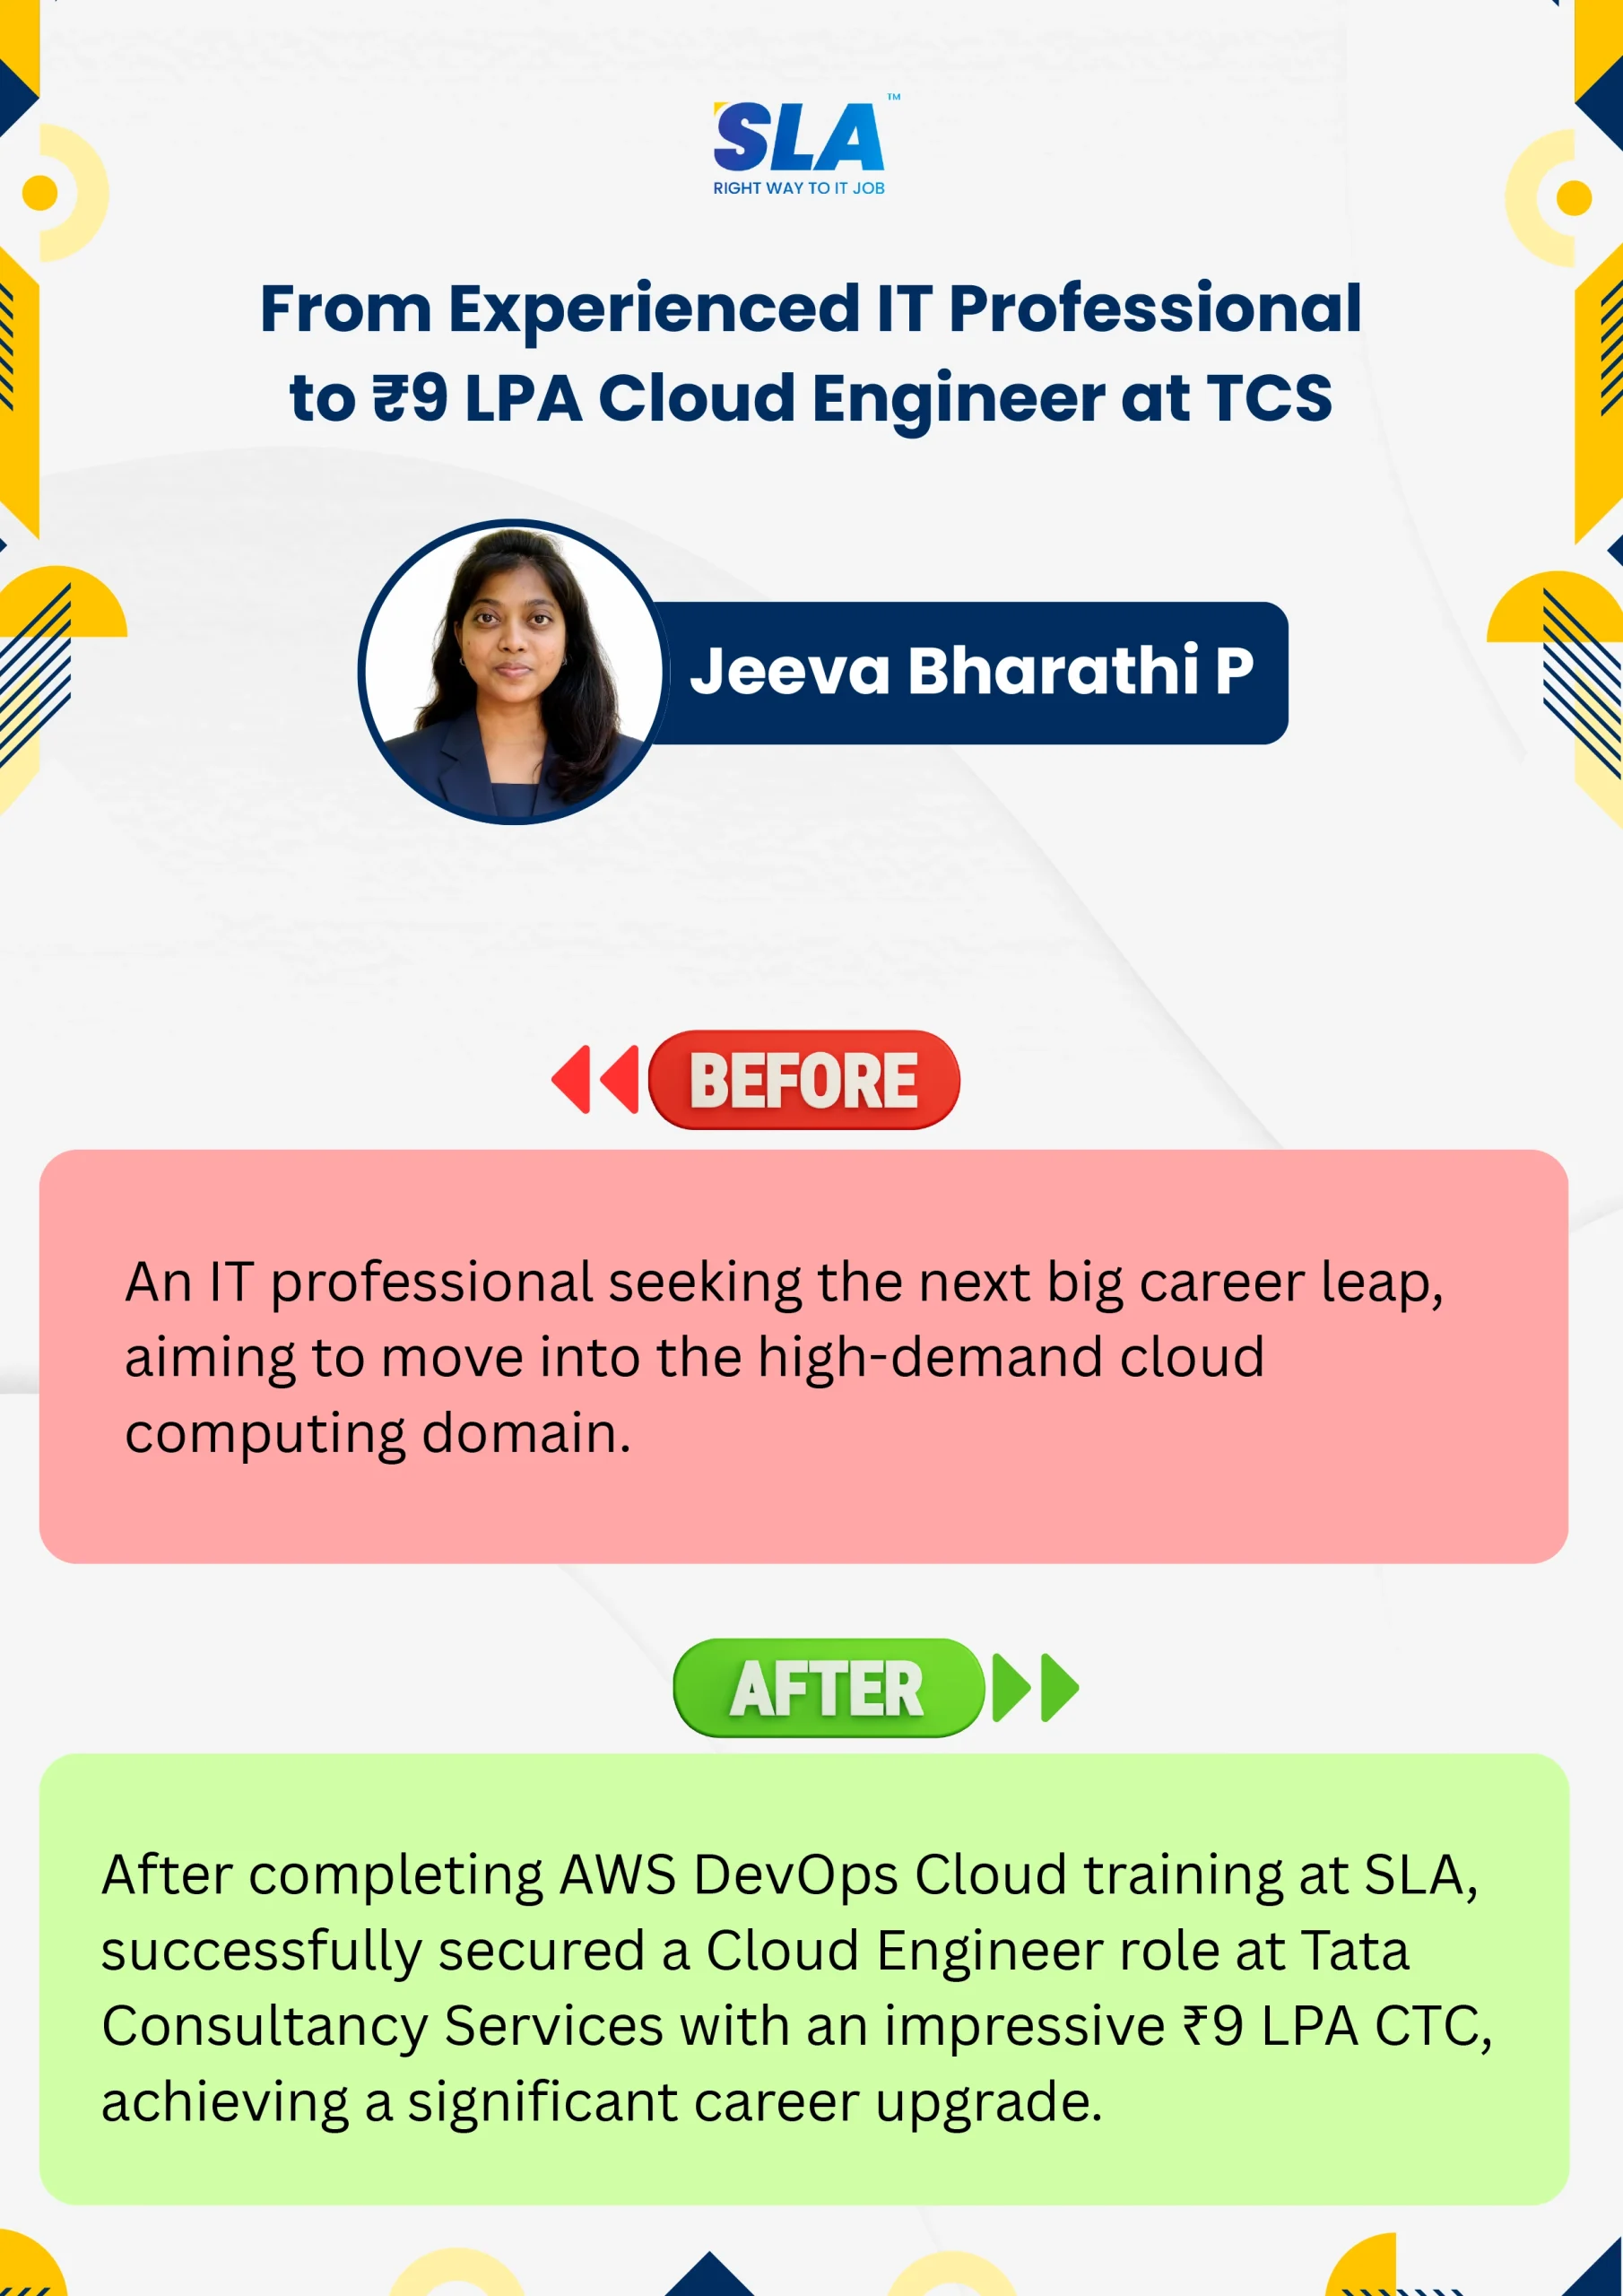
Google Reviews

Rating
4.8
1,053 Google reviews

Shaaru Menan
I had a 3 year career break. Joined SLA on Java Full Stack course and completed it.Did projects with the help of my Mentor. They…

Click here for Full Review

SARAN M
SLA Institute provides training in communication and aptitude along with strong technical skills. The trainers explain concepts clearly with a practical approach, which helps build…
Click here for Full Review

NalluKumar Ravichandran
Hi, I recently completed the DOT NET Full Stack Development course at SLA, and I had a great learning experience. The teaching style and student…
Click here for Full Review

Nithish Sahoo
I had an excellent experience taking this DevOps course. The curriculum is well-structured and covers both fundamental and advanced DevOps concepts in a clear manner.…
Click here for Full Review

MATHAN KUMAR G EEE
SLA Institute provides a structured learning environment for data analytics. The syllabus is relevant, and trainers are knowledgeable. Some sessions were very useful practically, while…
Click here for Full Review

Surya
Special thanks to Vishal Sir, the Placement Officer, for his interview guidance, resume support, and continuous motivation throughout the placement process. I would also like…
Click here for Full Review