
Opens in a new tab
Software Training Institute in Chennai with 100% Placements – SLA Institute

Data Science Course For Beginners

4.70
(1204)
DURATION
Real-Time Location Services
3 Months
EMI
0% Interest
Mode
Rank-Based Percentile Gui Calculator using Tkinter
Live Online / Offline

Softlogic is one of the Top Training institutes for Data Science. Learn how to use Data Science, from beginner basics to advanced techniques. Our Data Science Syllabus Covers Python programming, statistics, data wrangling, data visualization, machine learning, deep learning, and big data analytics. We offer a Data Science Course with Placement Assistance, Mock interviews, Resume building, and certification.

Enroll Now
Download Syllabus
0%

AI Powered Syllabus

0+

Realtime Projects

0+

Students Placed in Sept

0+

Certificates

Check Your Eligibilty for IT Training

Ready to start your tech career? Whether you have recently graduated and want to begin your IT career, or want to upskill for your next phase, our Eligibility Assessment Form makes the process easy to begin. For this Data Science Course For Beginners Developer Course, we will match your skills and goals to the best training structure for you. Just fill in the form below for an easy start on your course. Take your first step today!
What We'll Need From You?
Personal & Contact Details
Name and phone number for direct interview updates
Academic Background
Age category, educational qualification, and graduation year.
Technical Experience
Prior programming knowledge and relevant IT certification details.
KNOW MORE ABOUT COURSE +91 86818 84318

IT Training ELIGIBILITY TEST

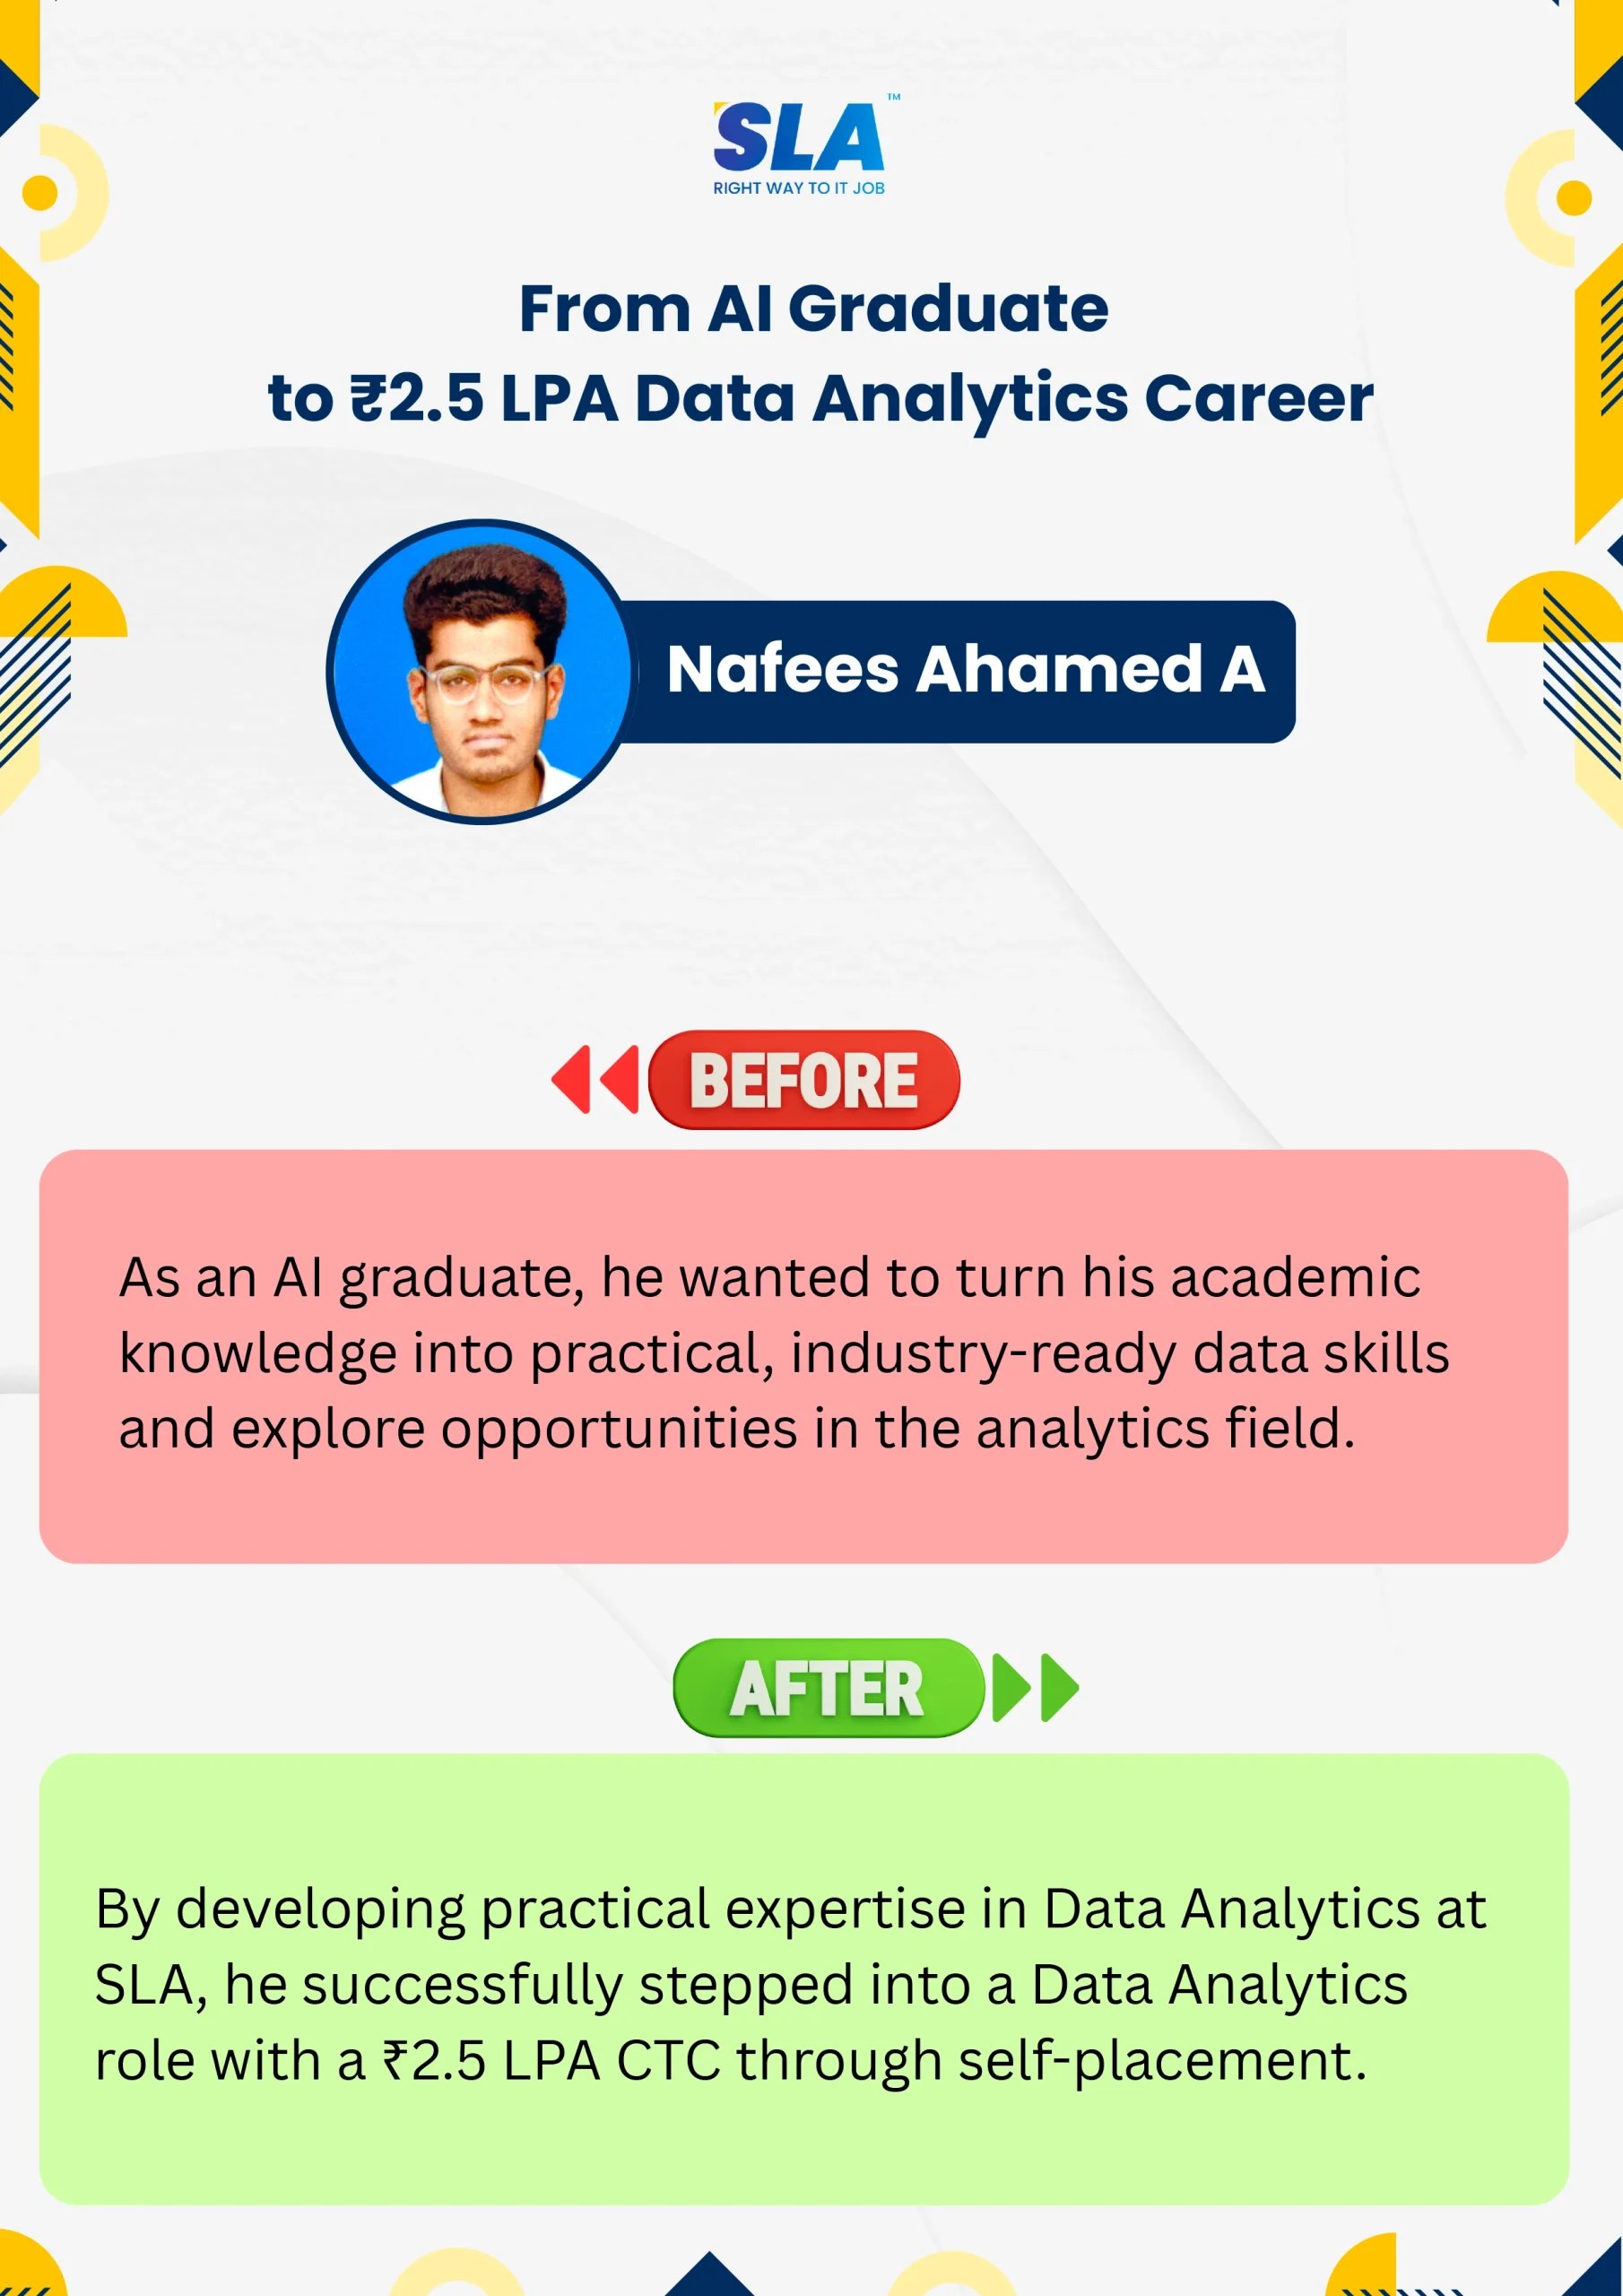
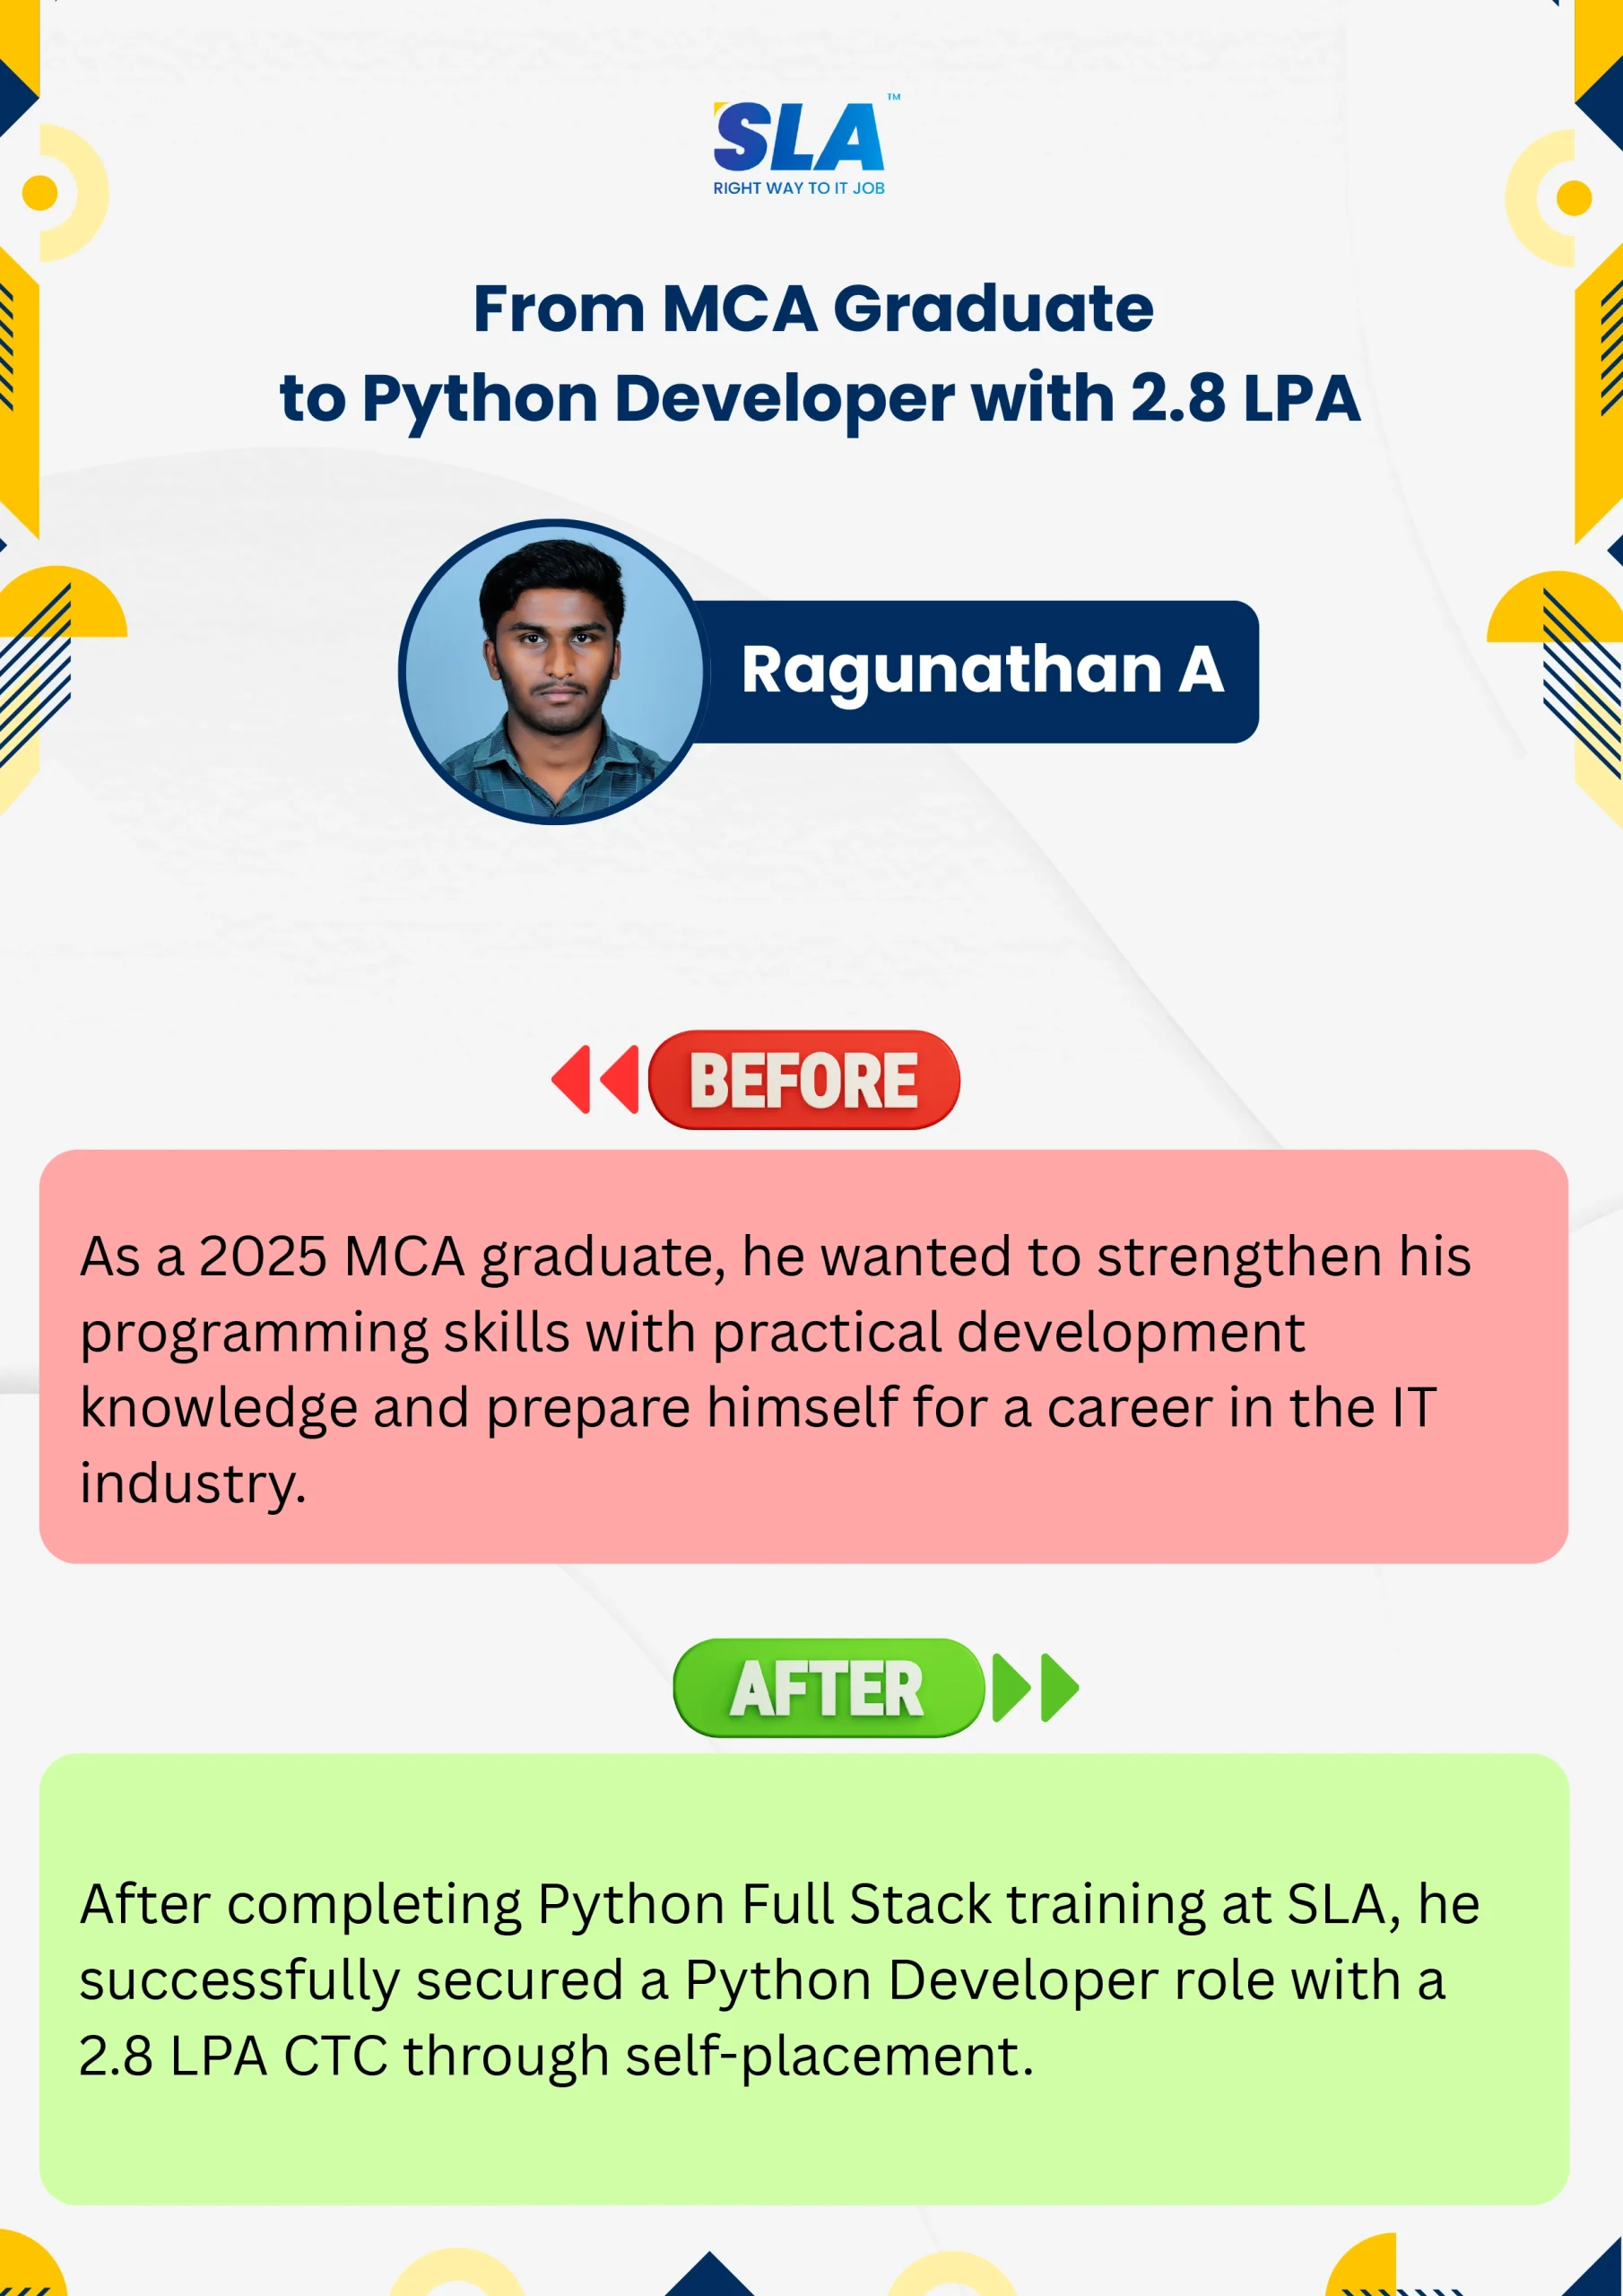
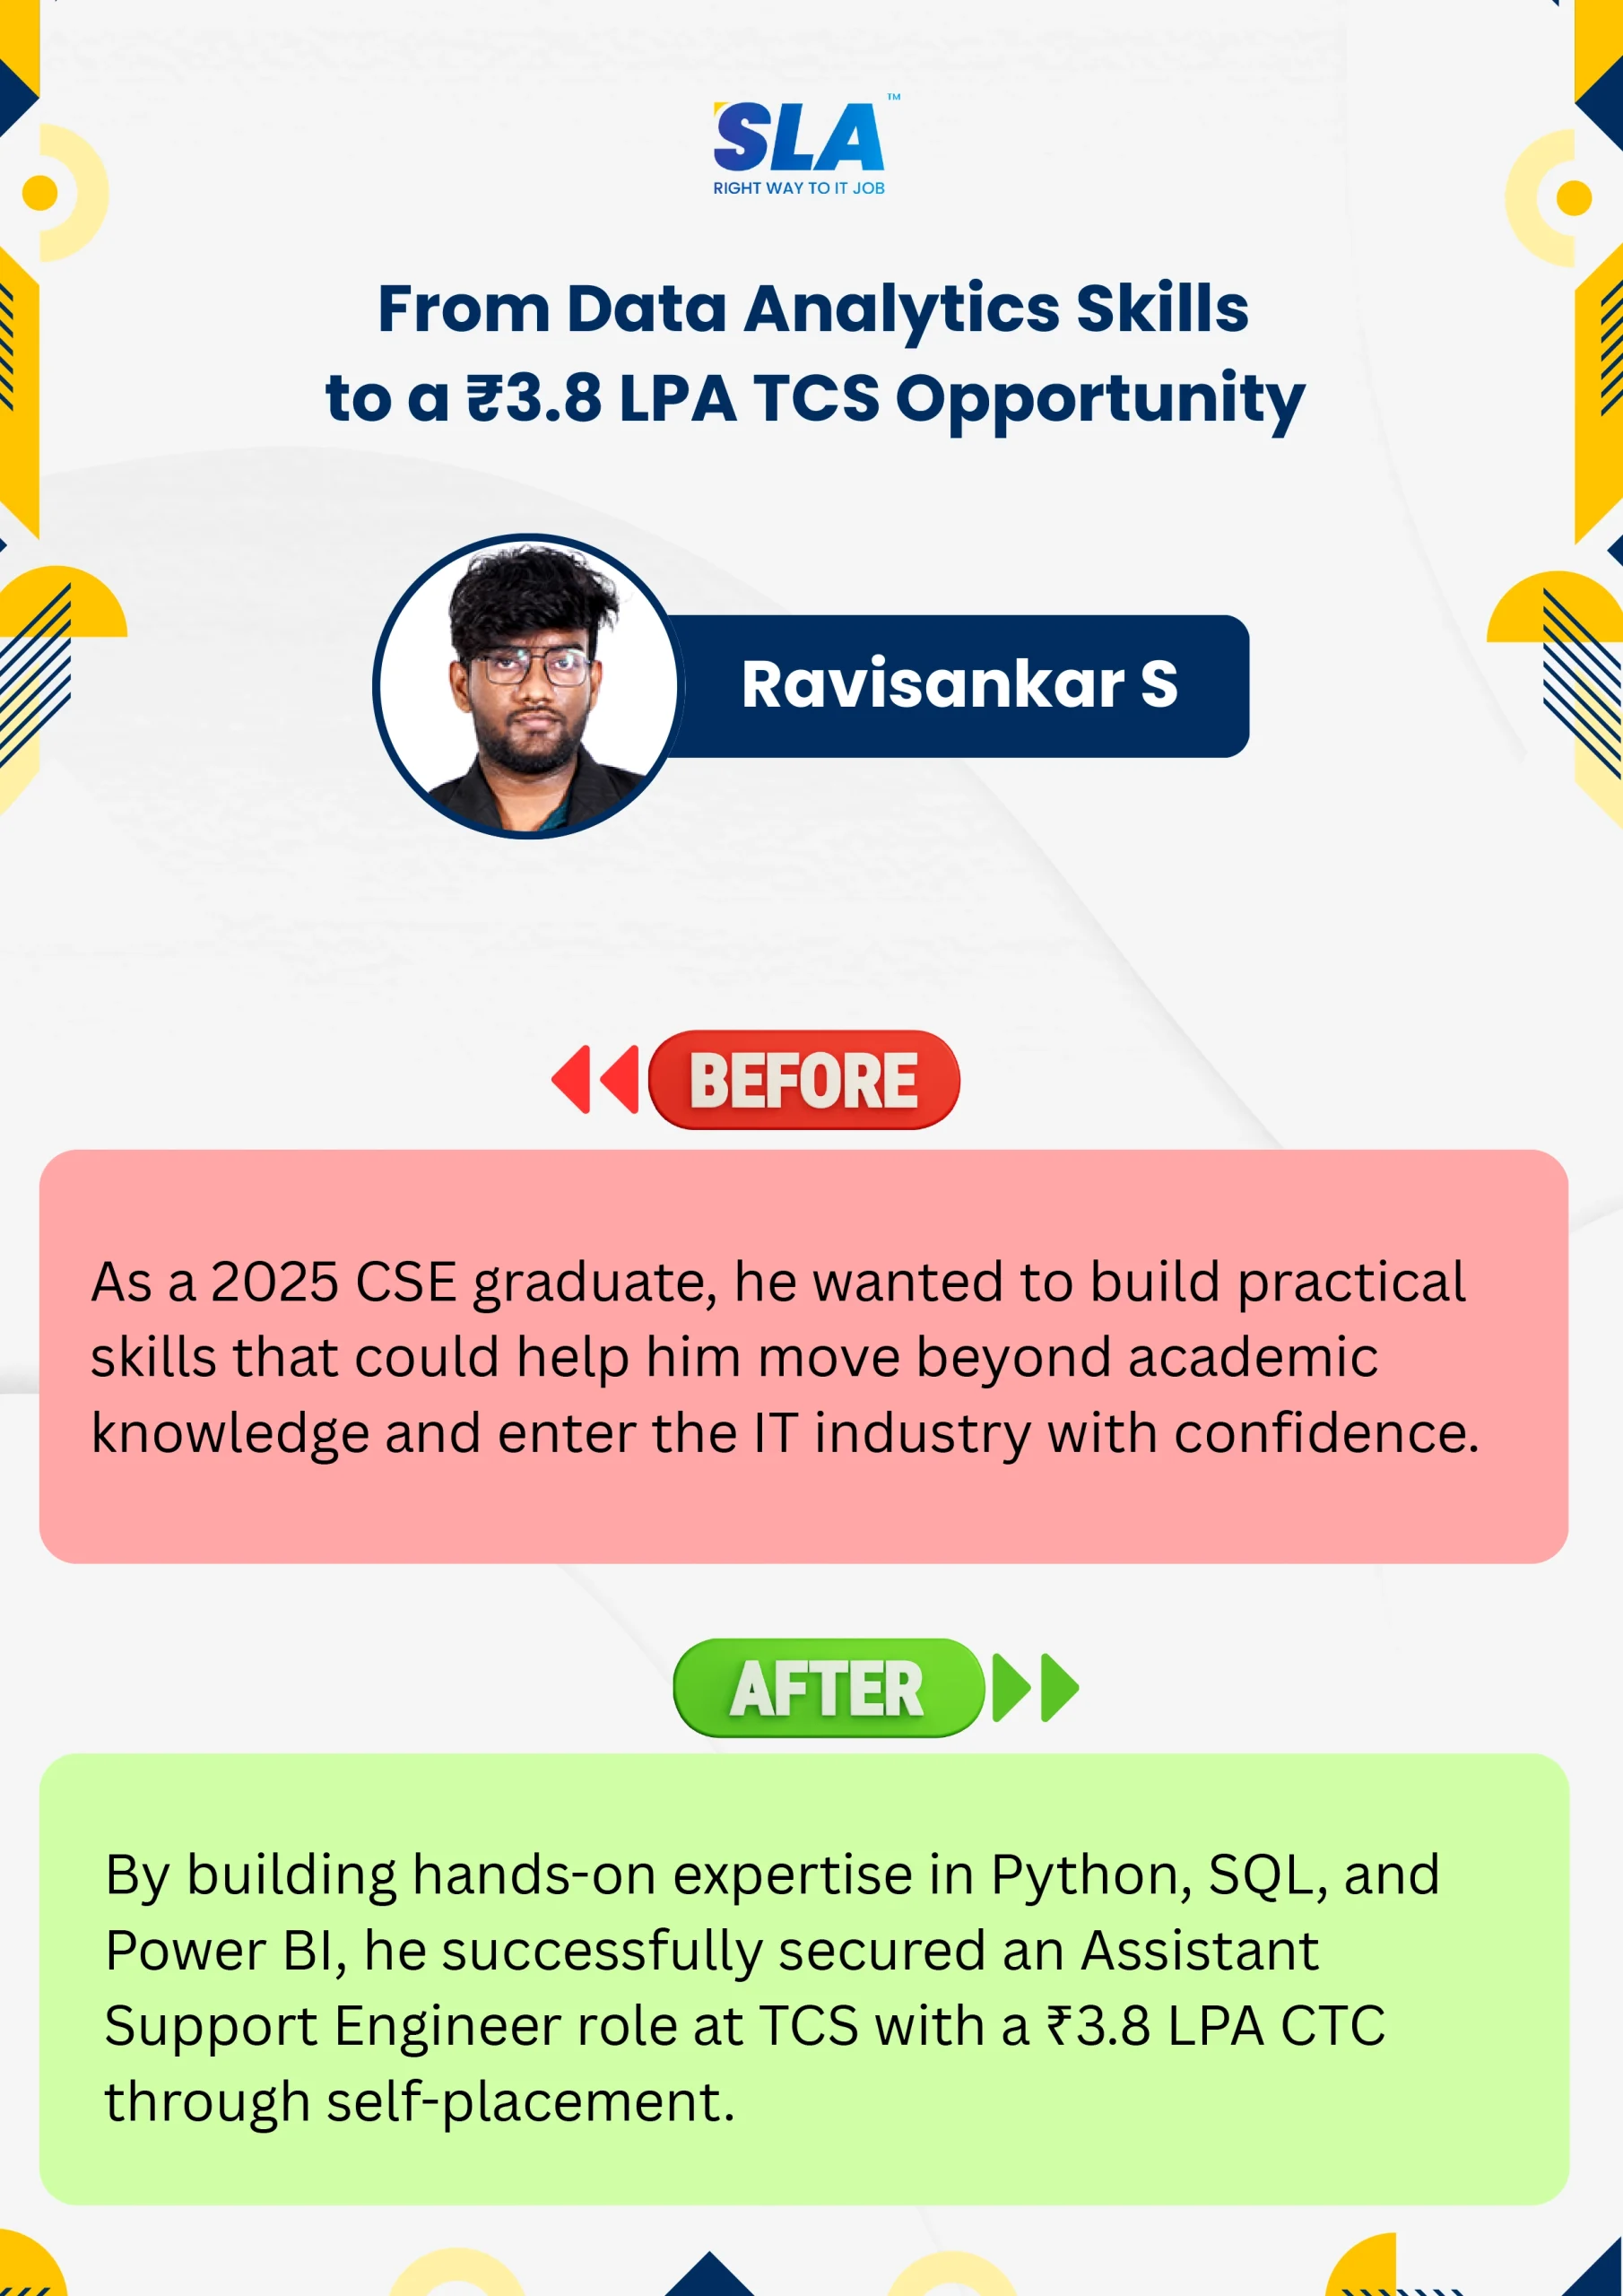
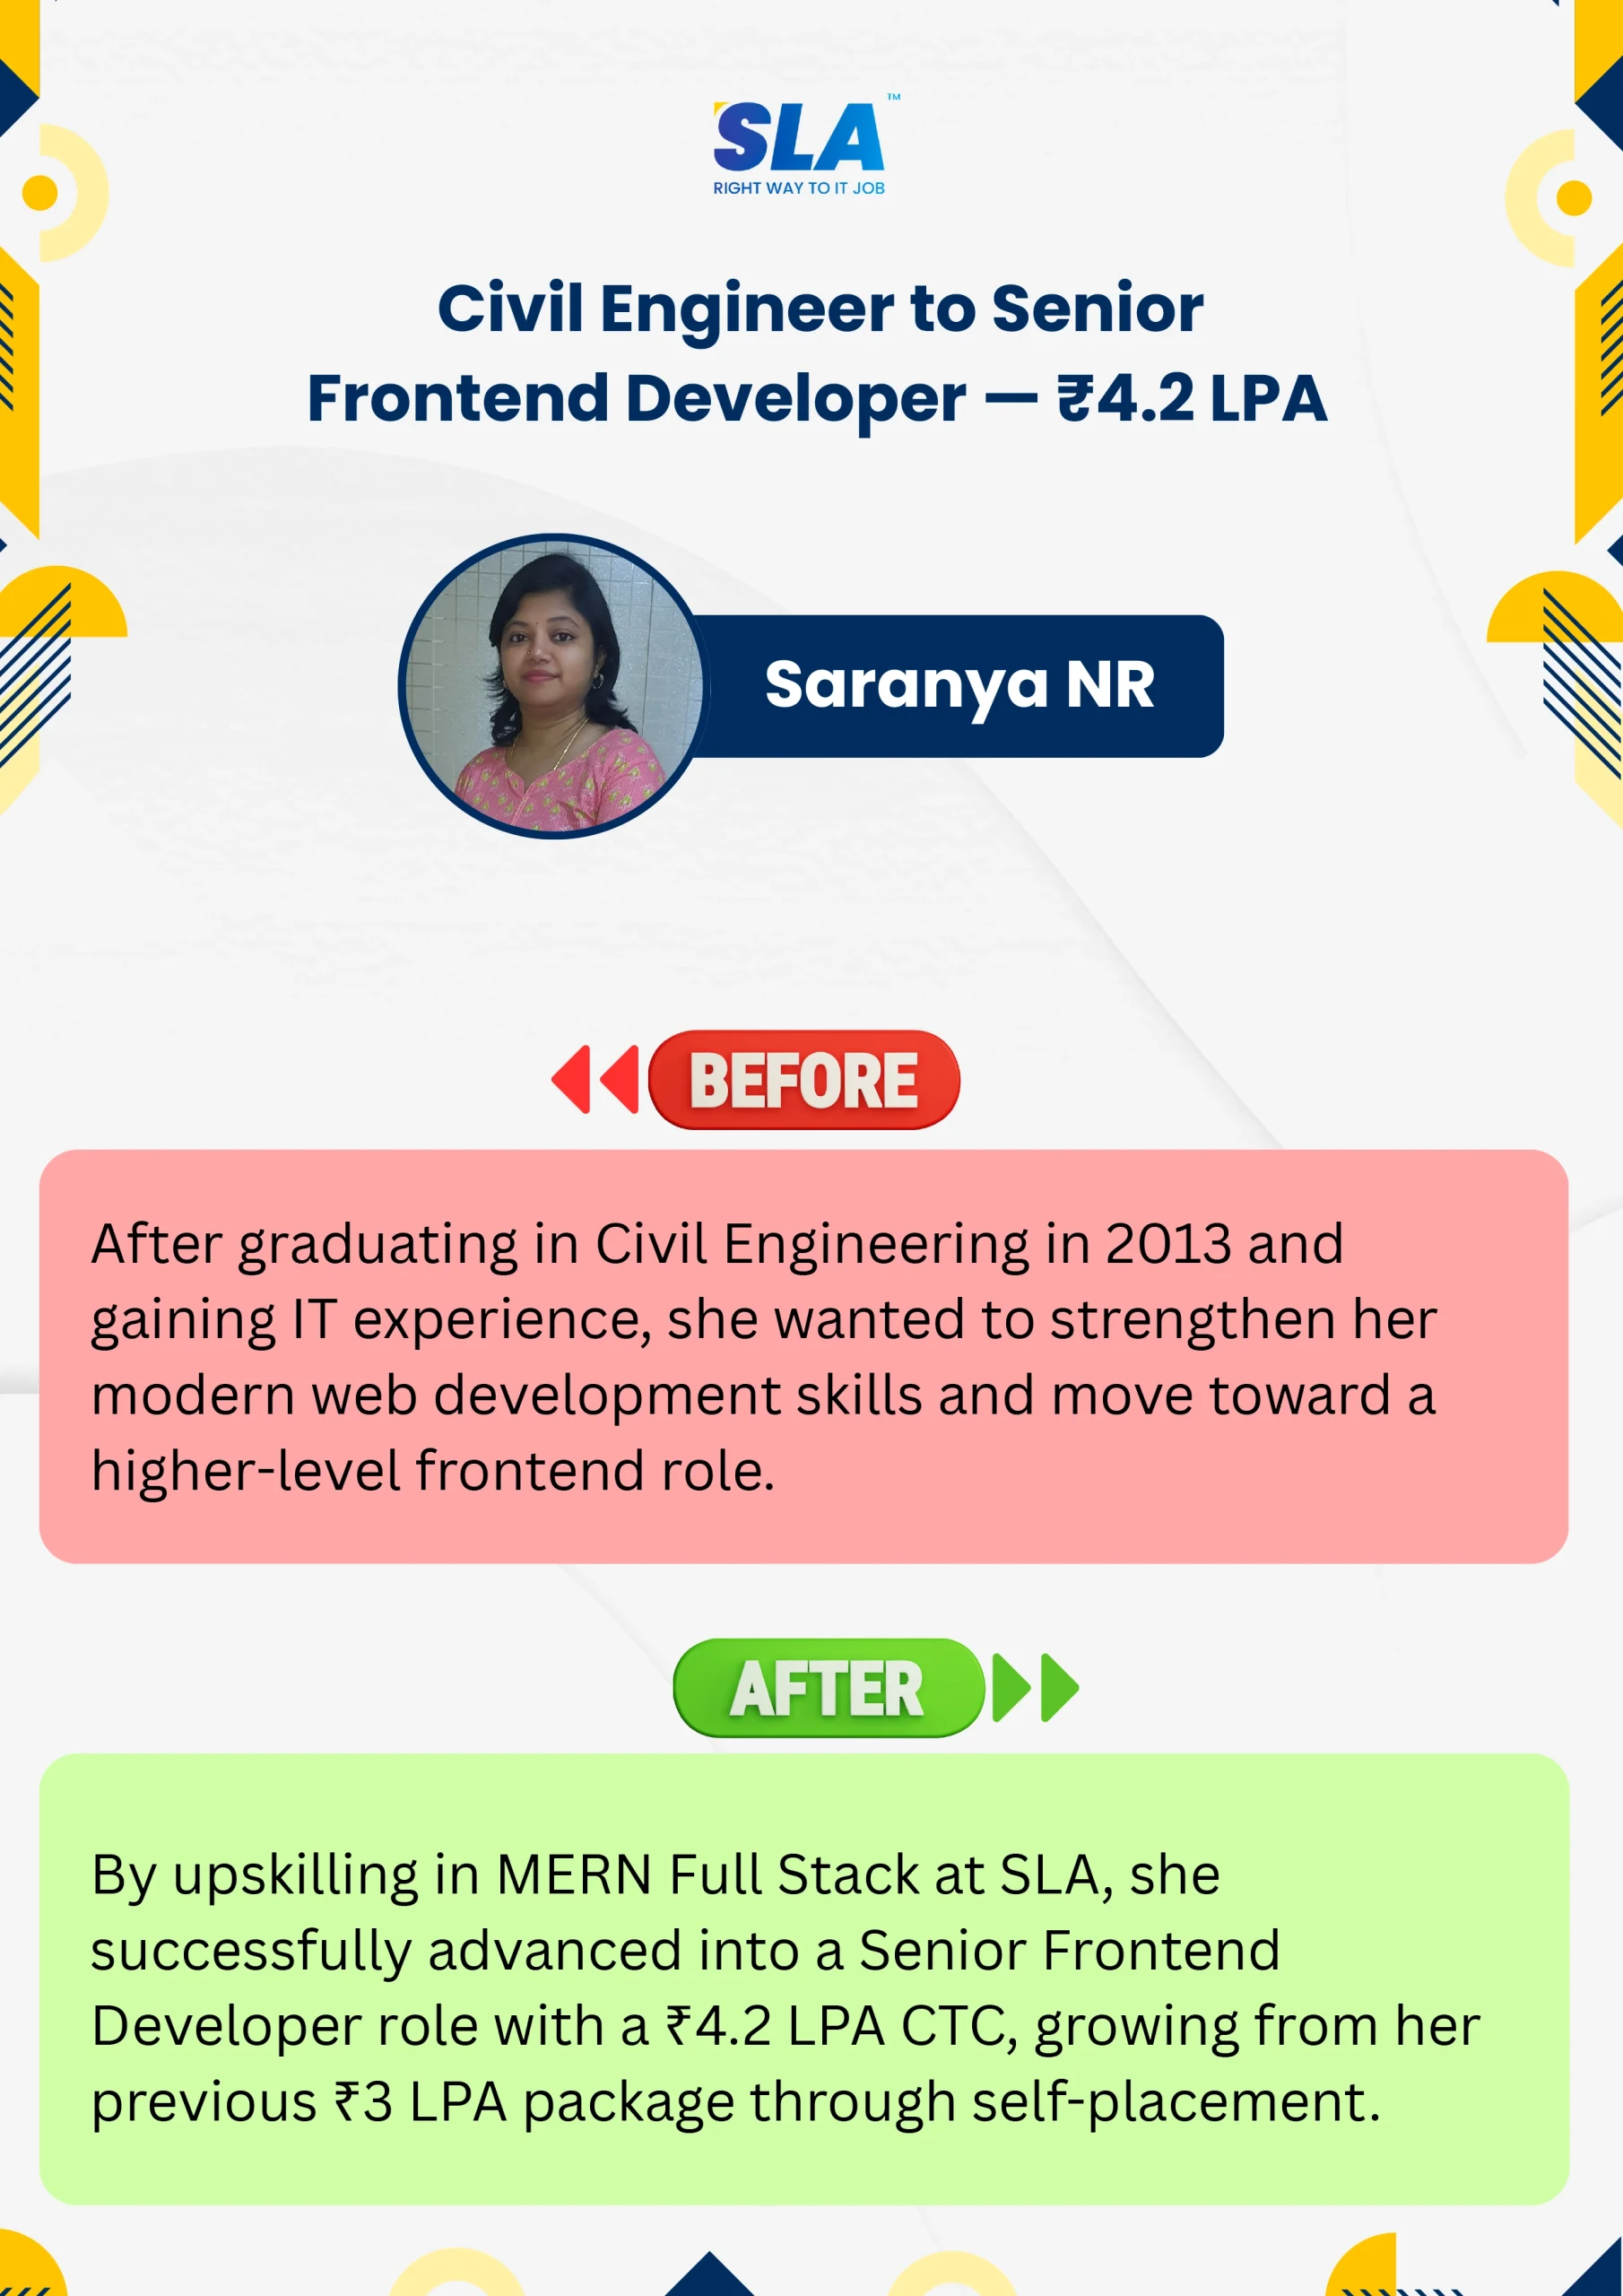
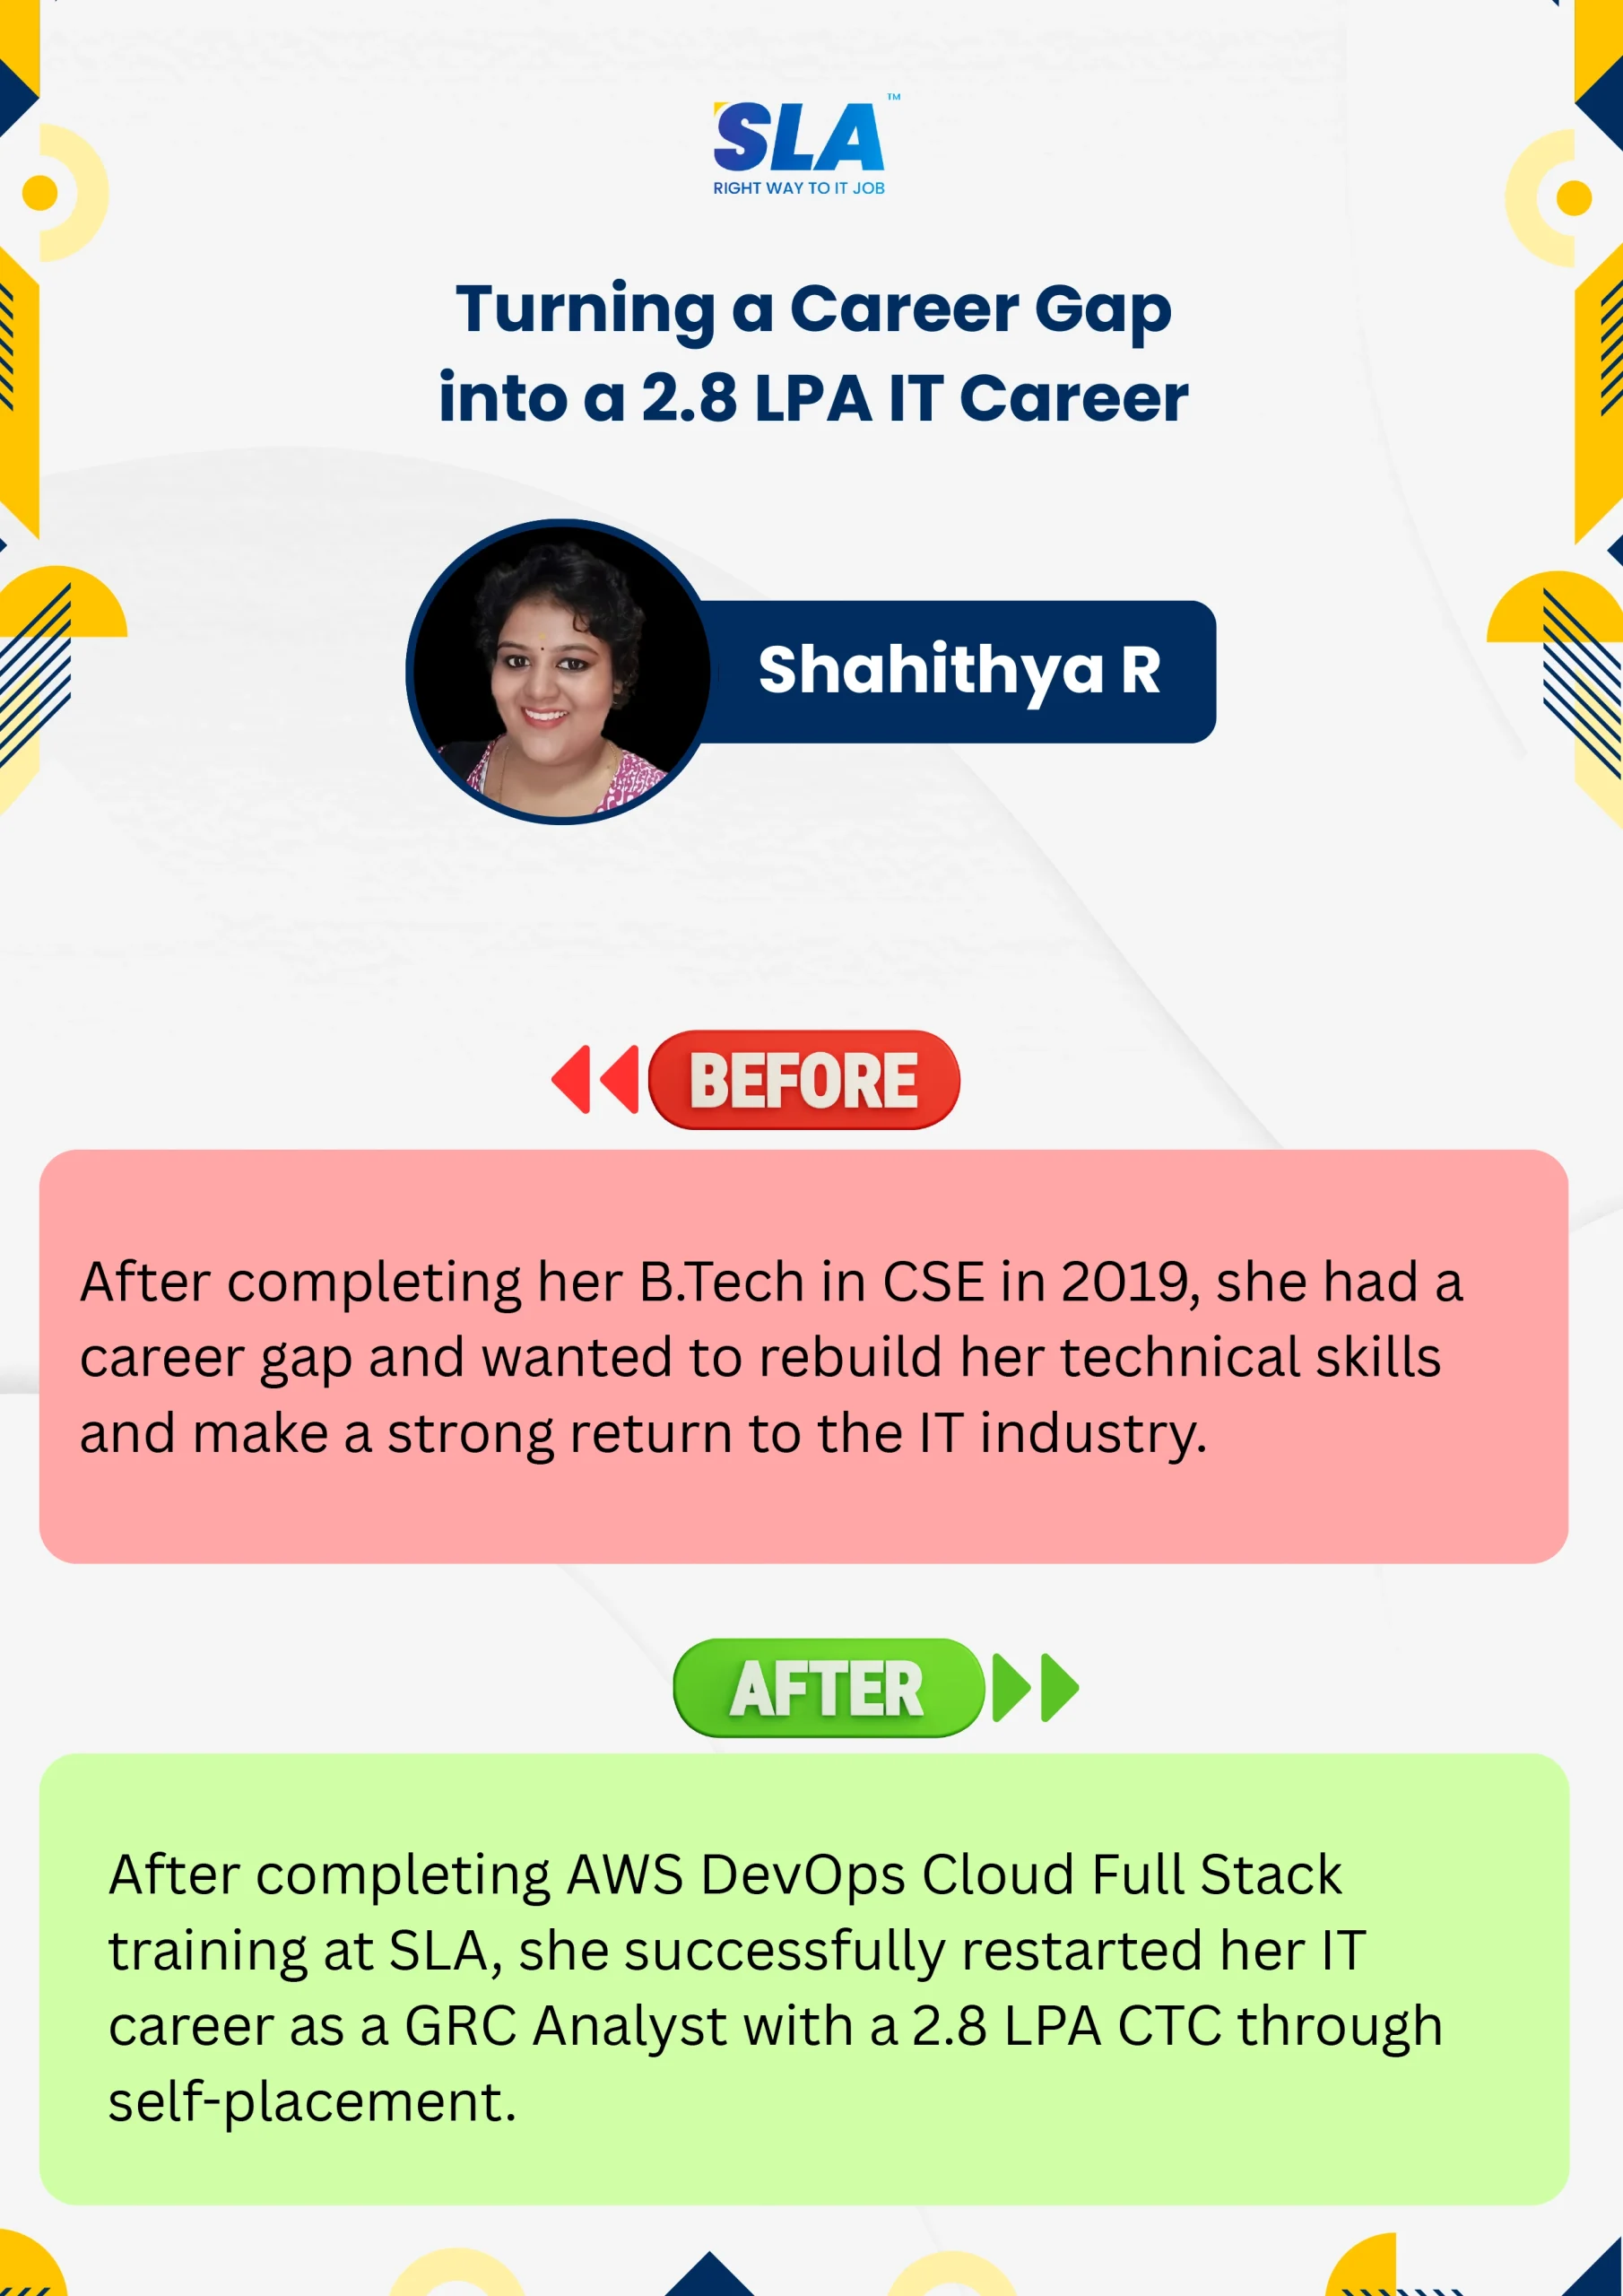
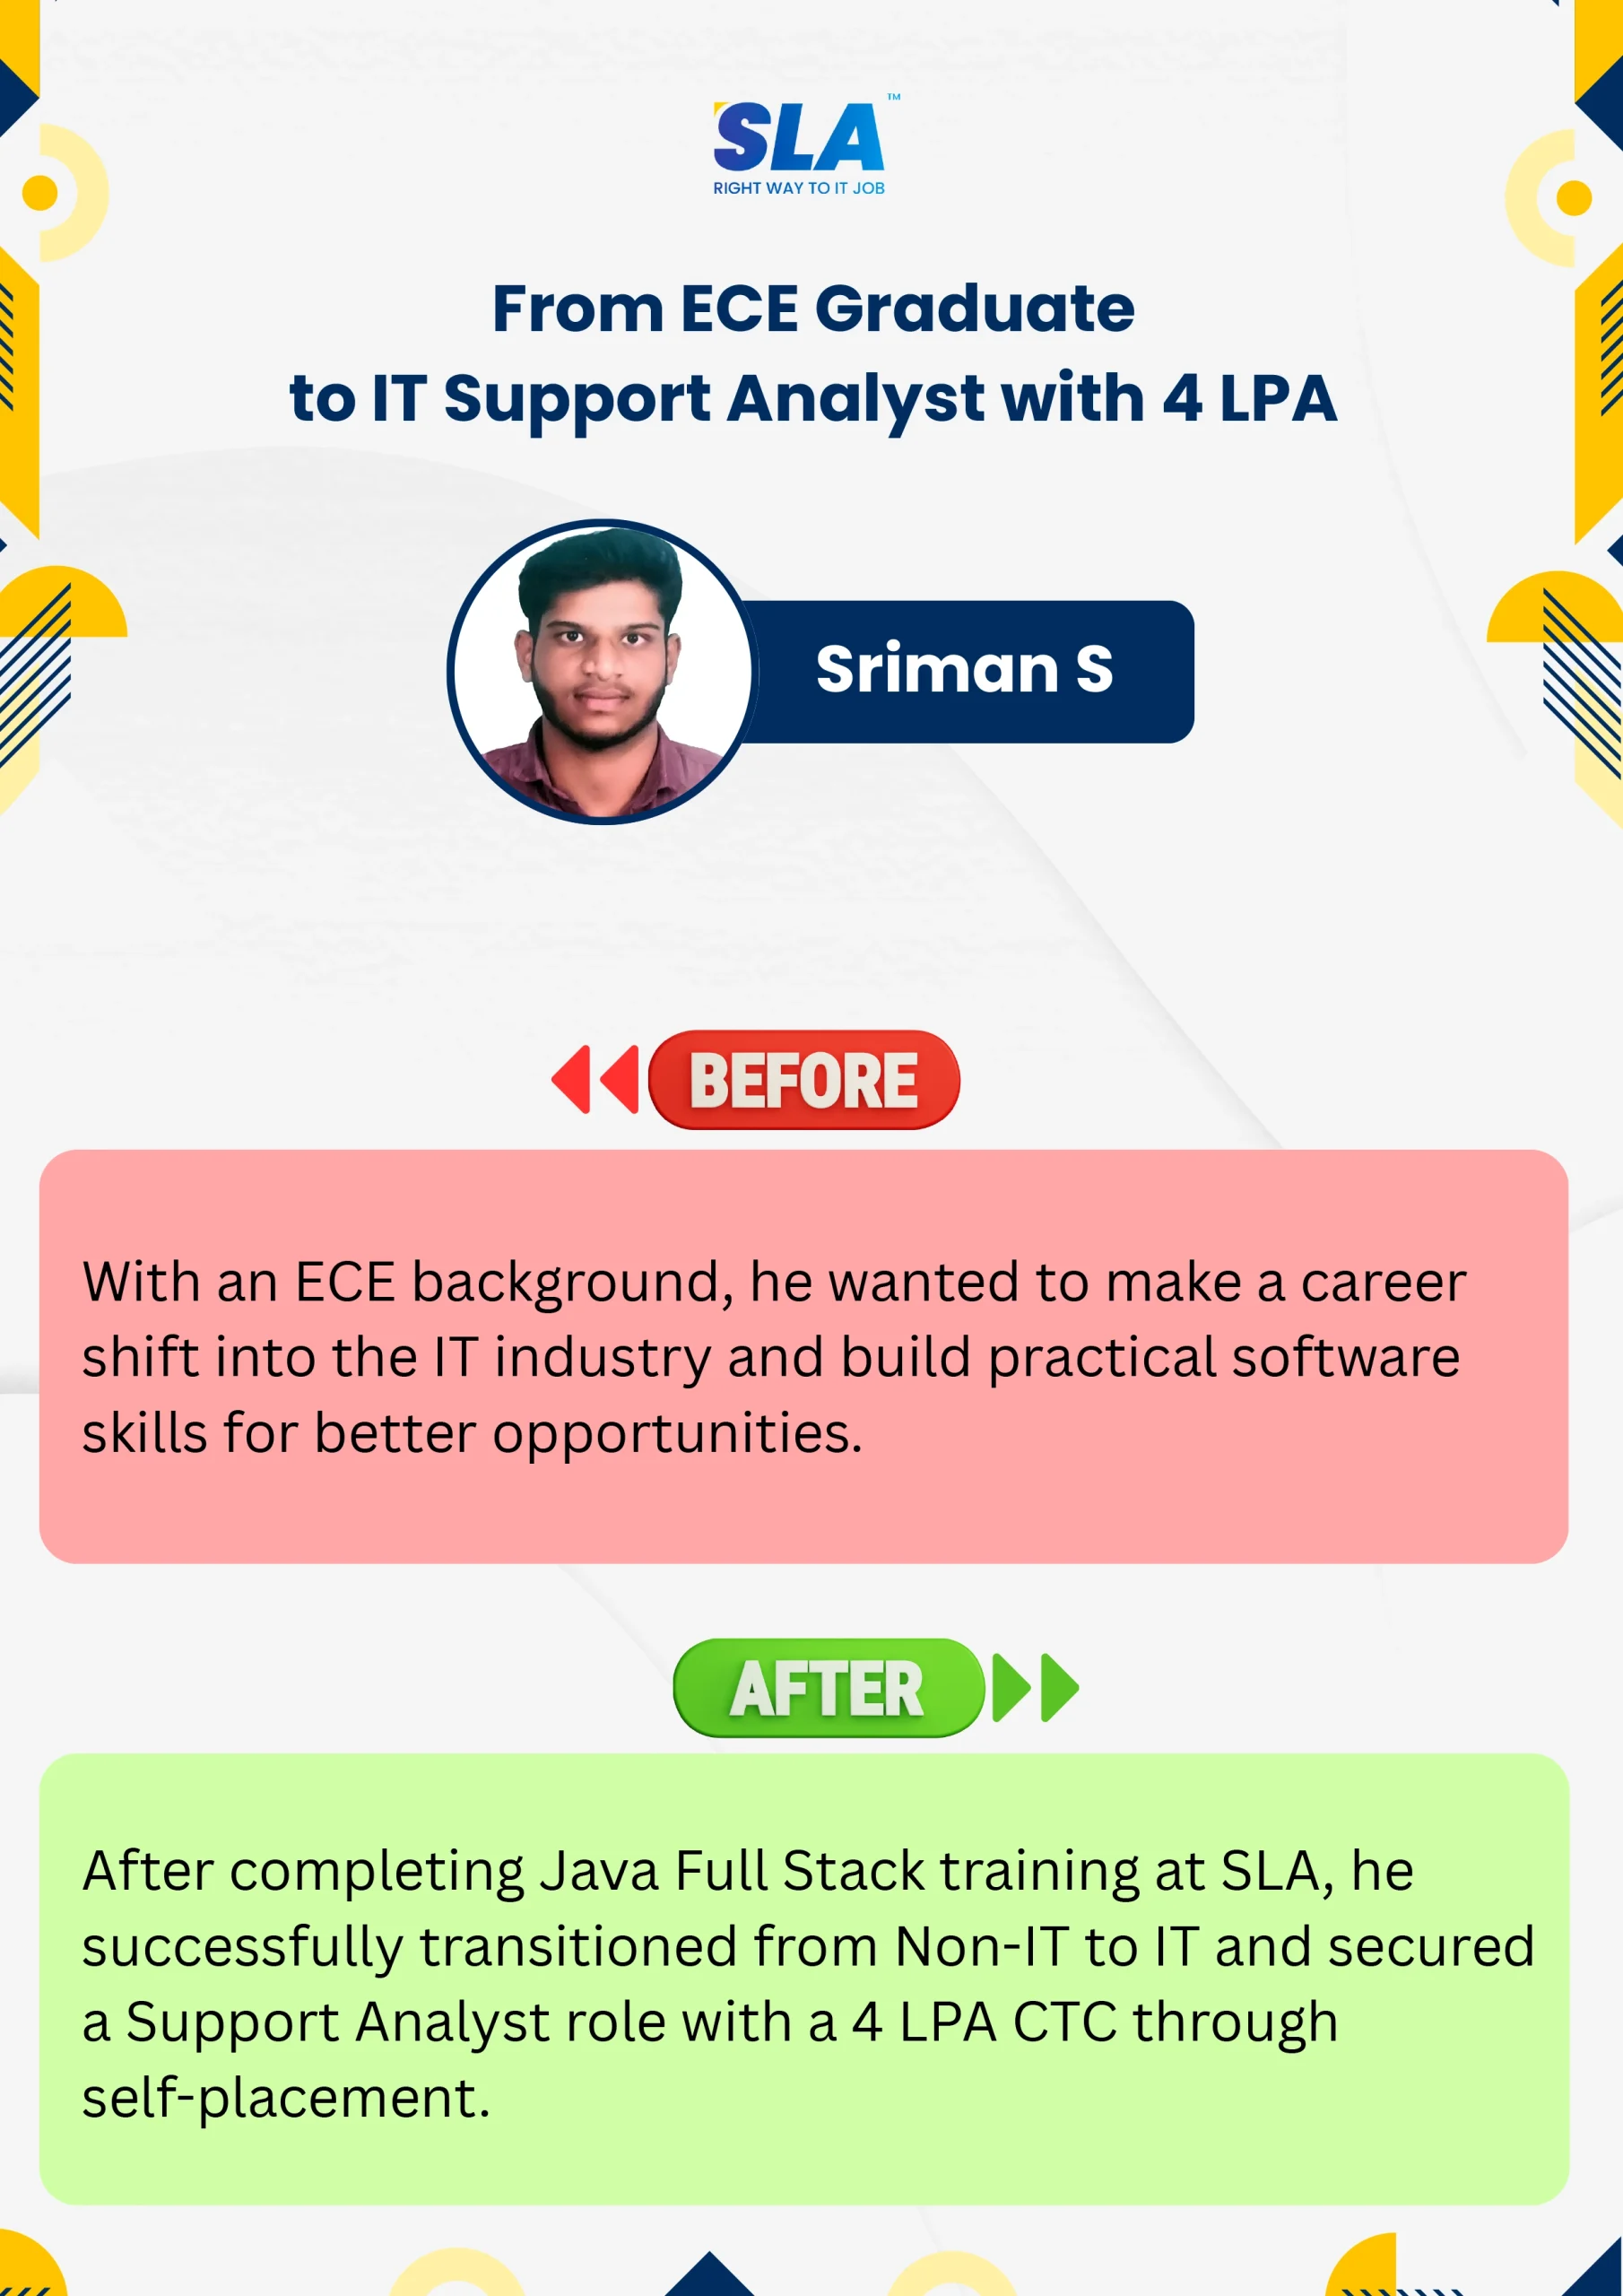
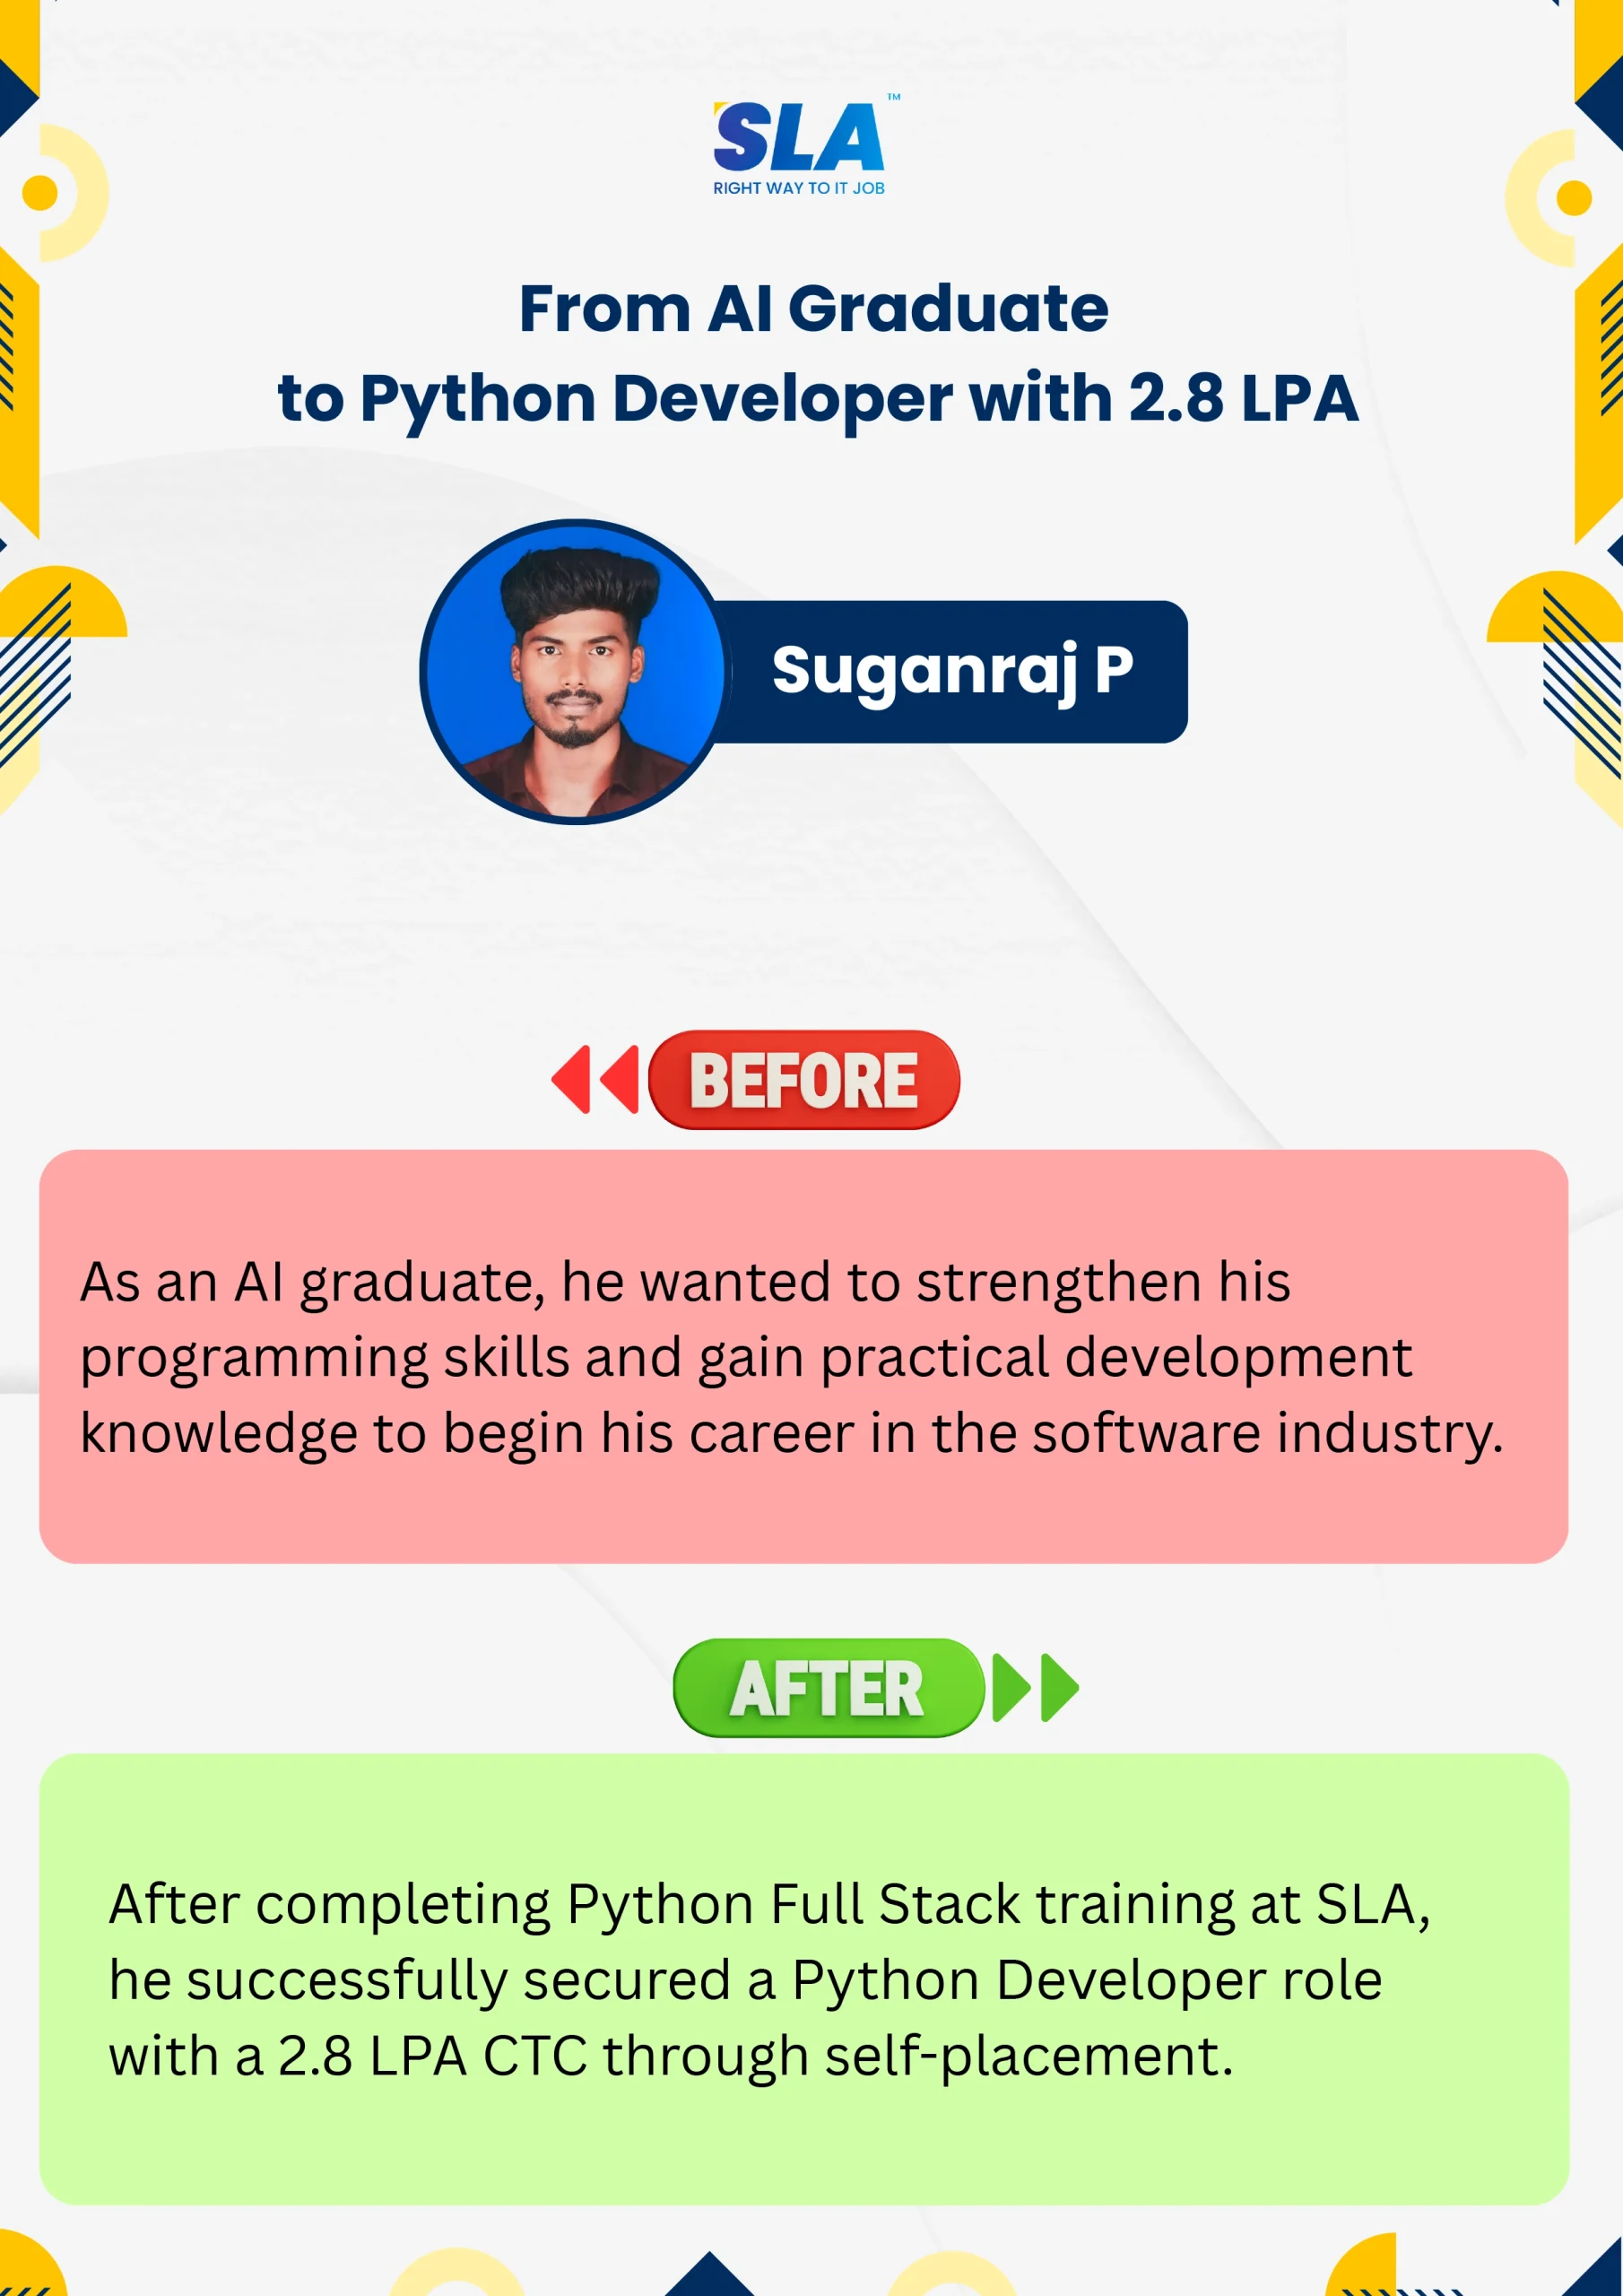
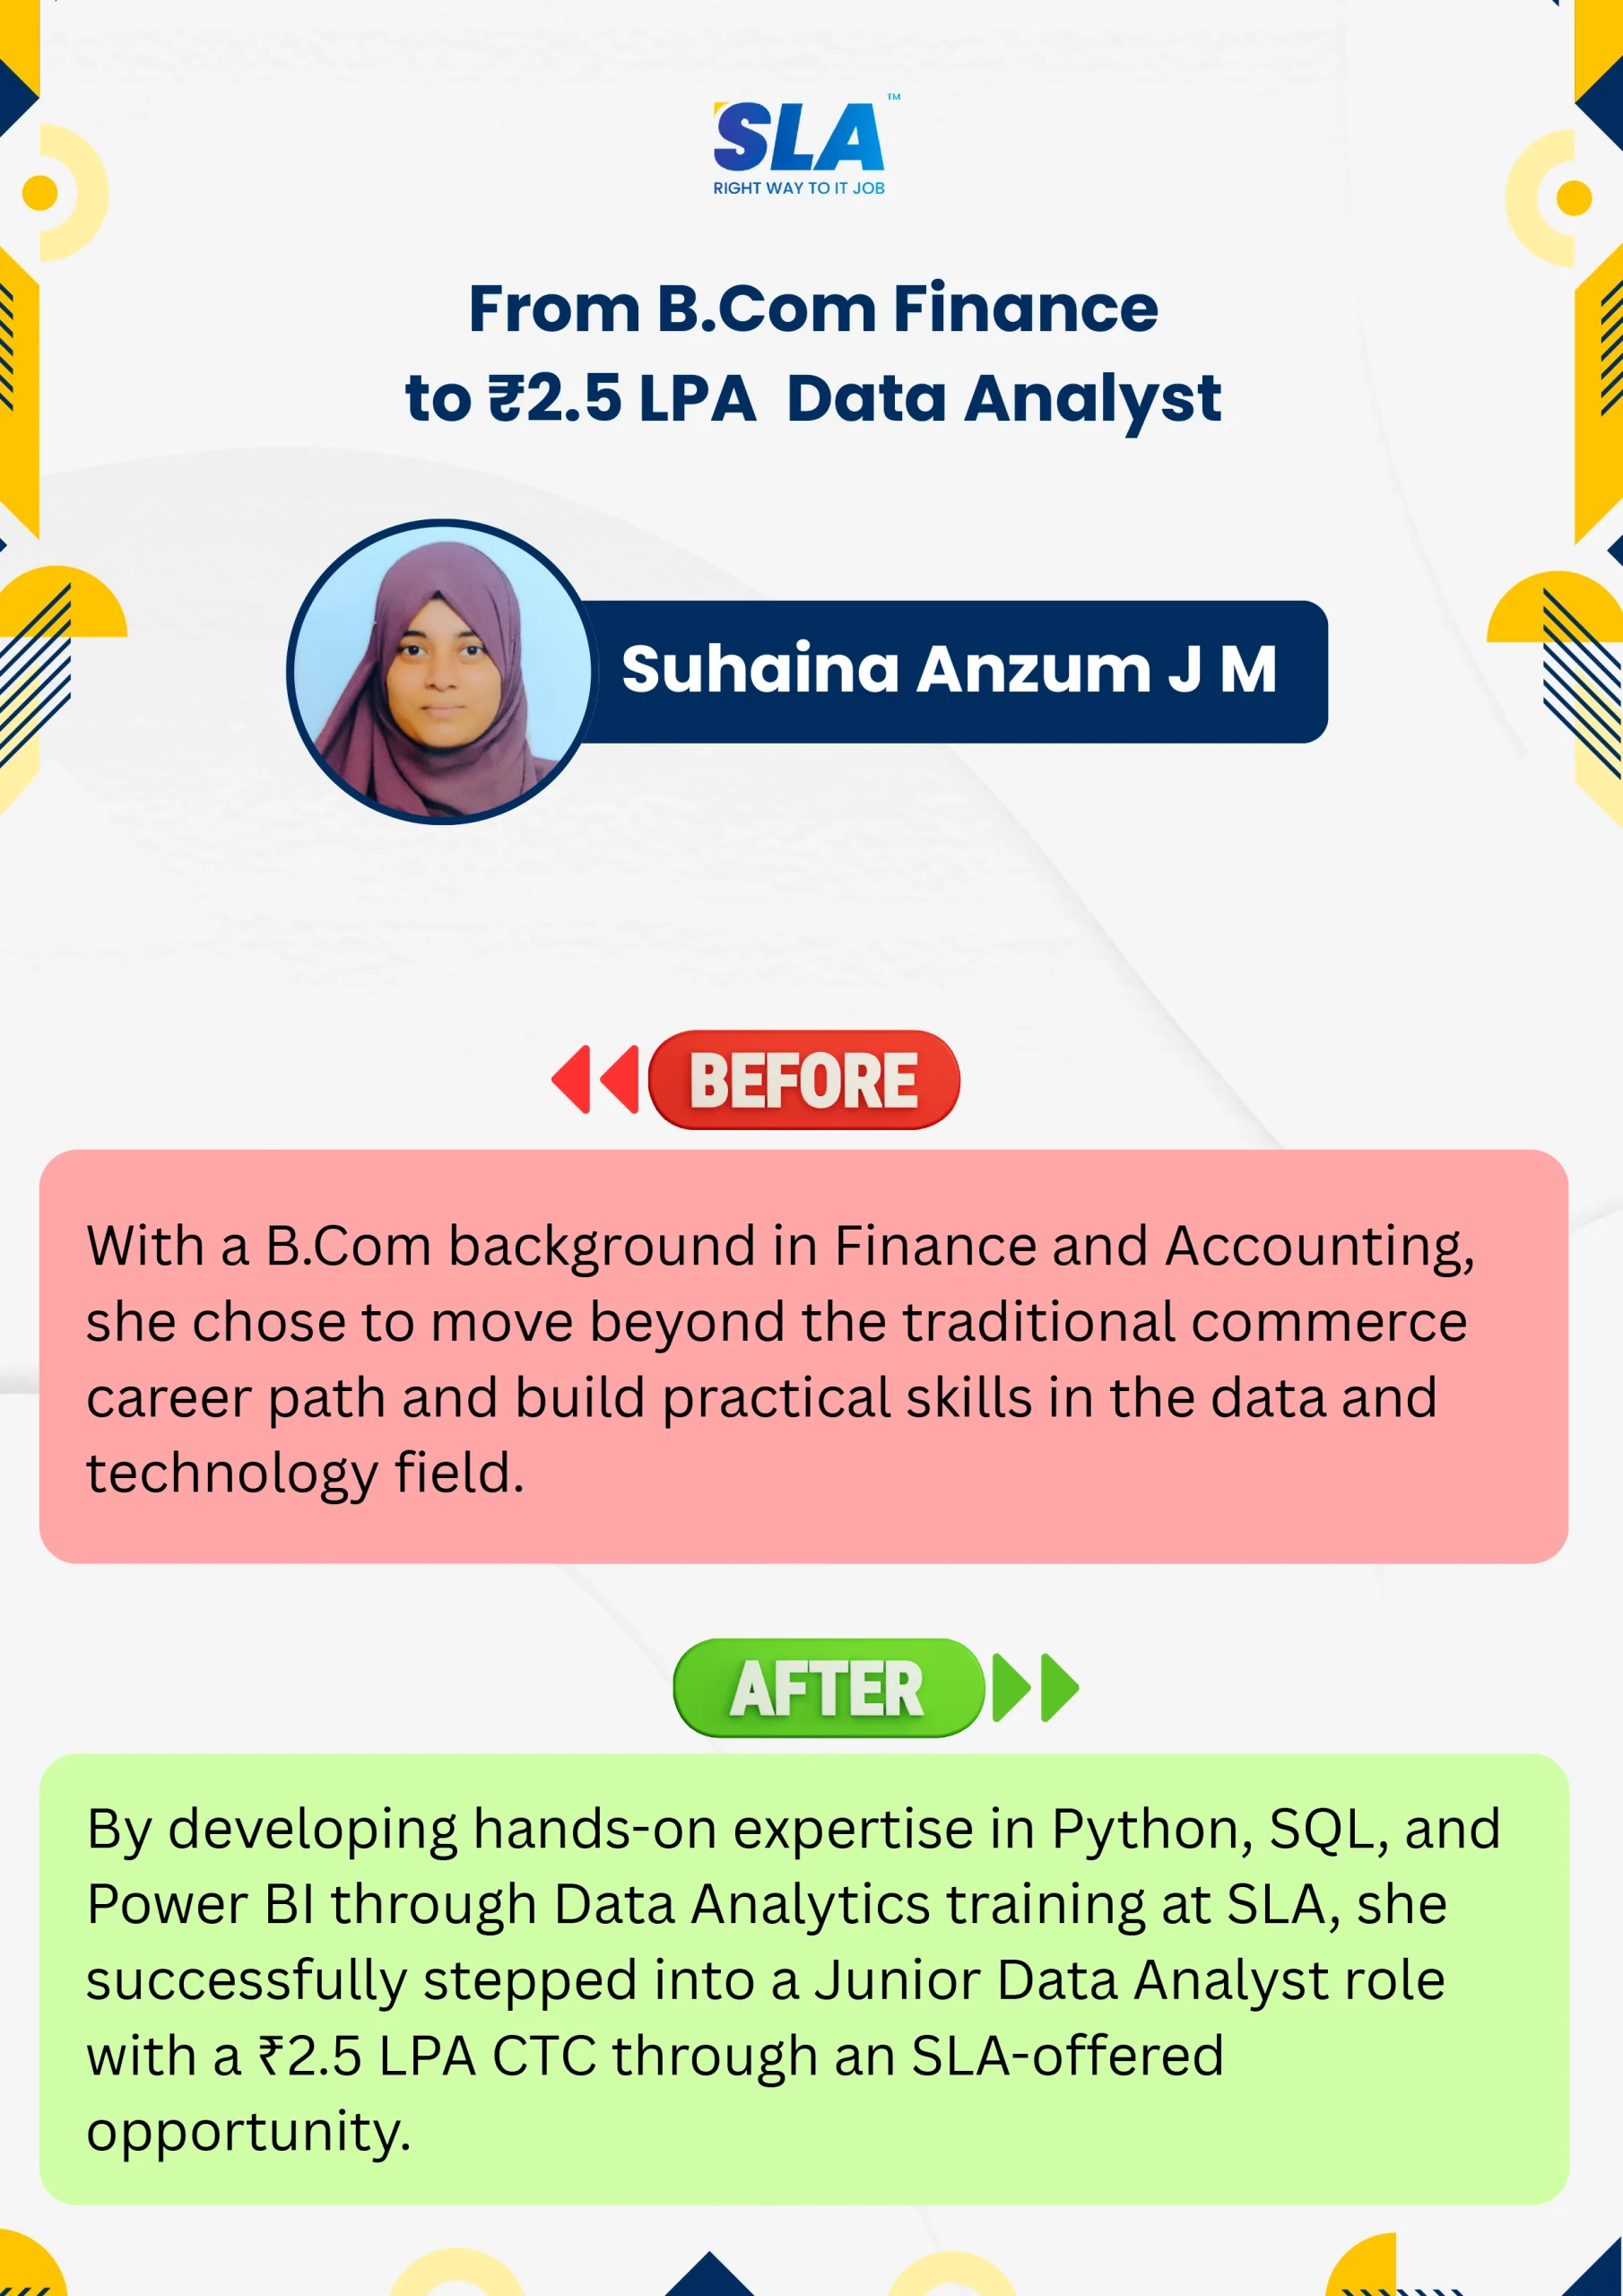
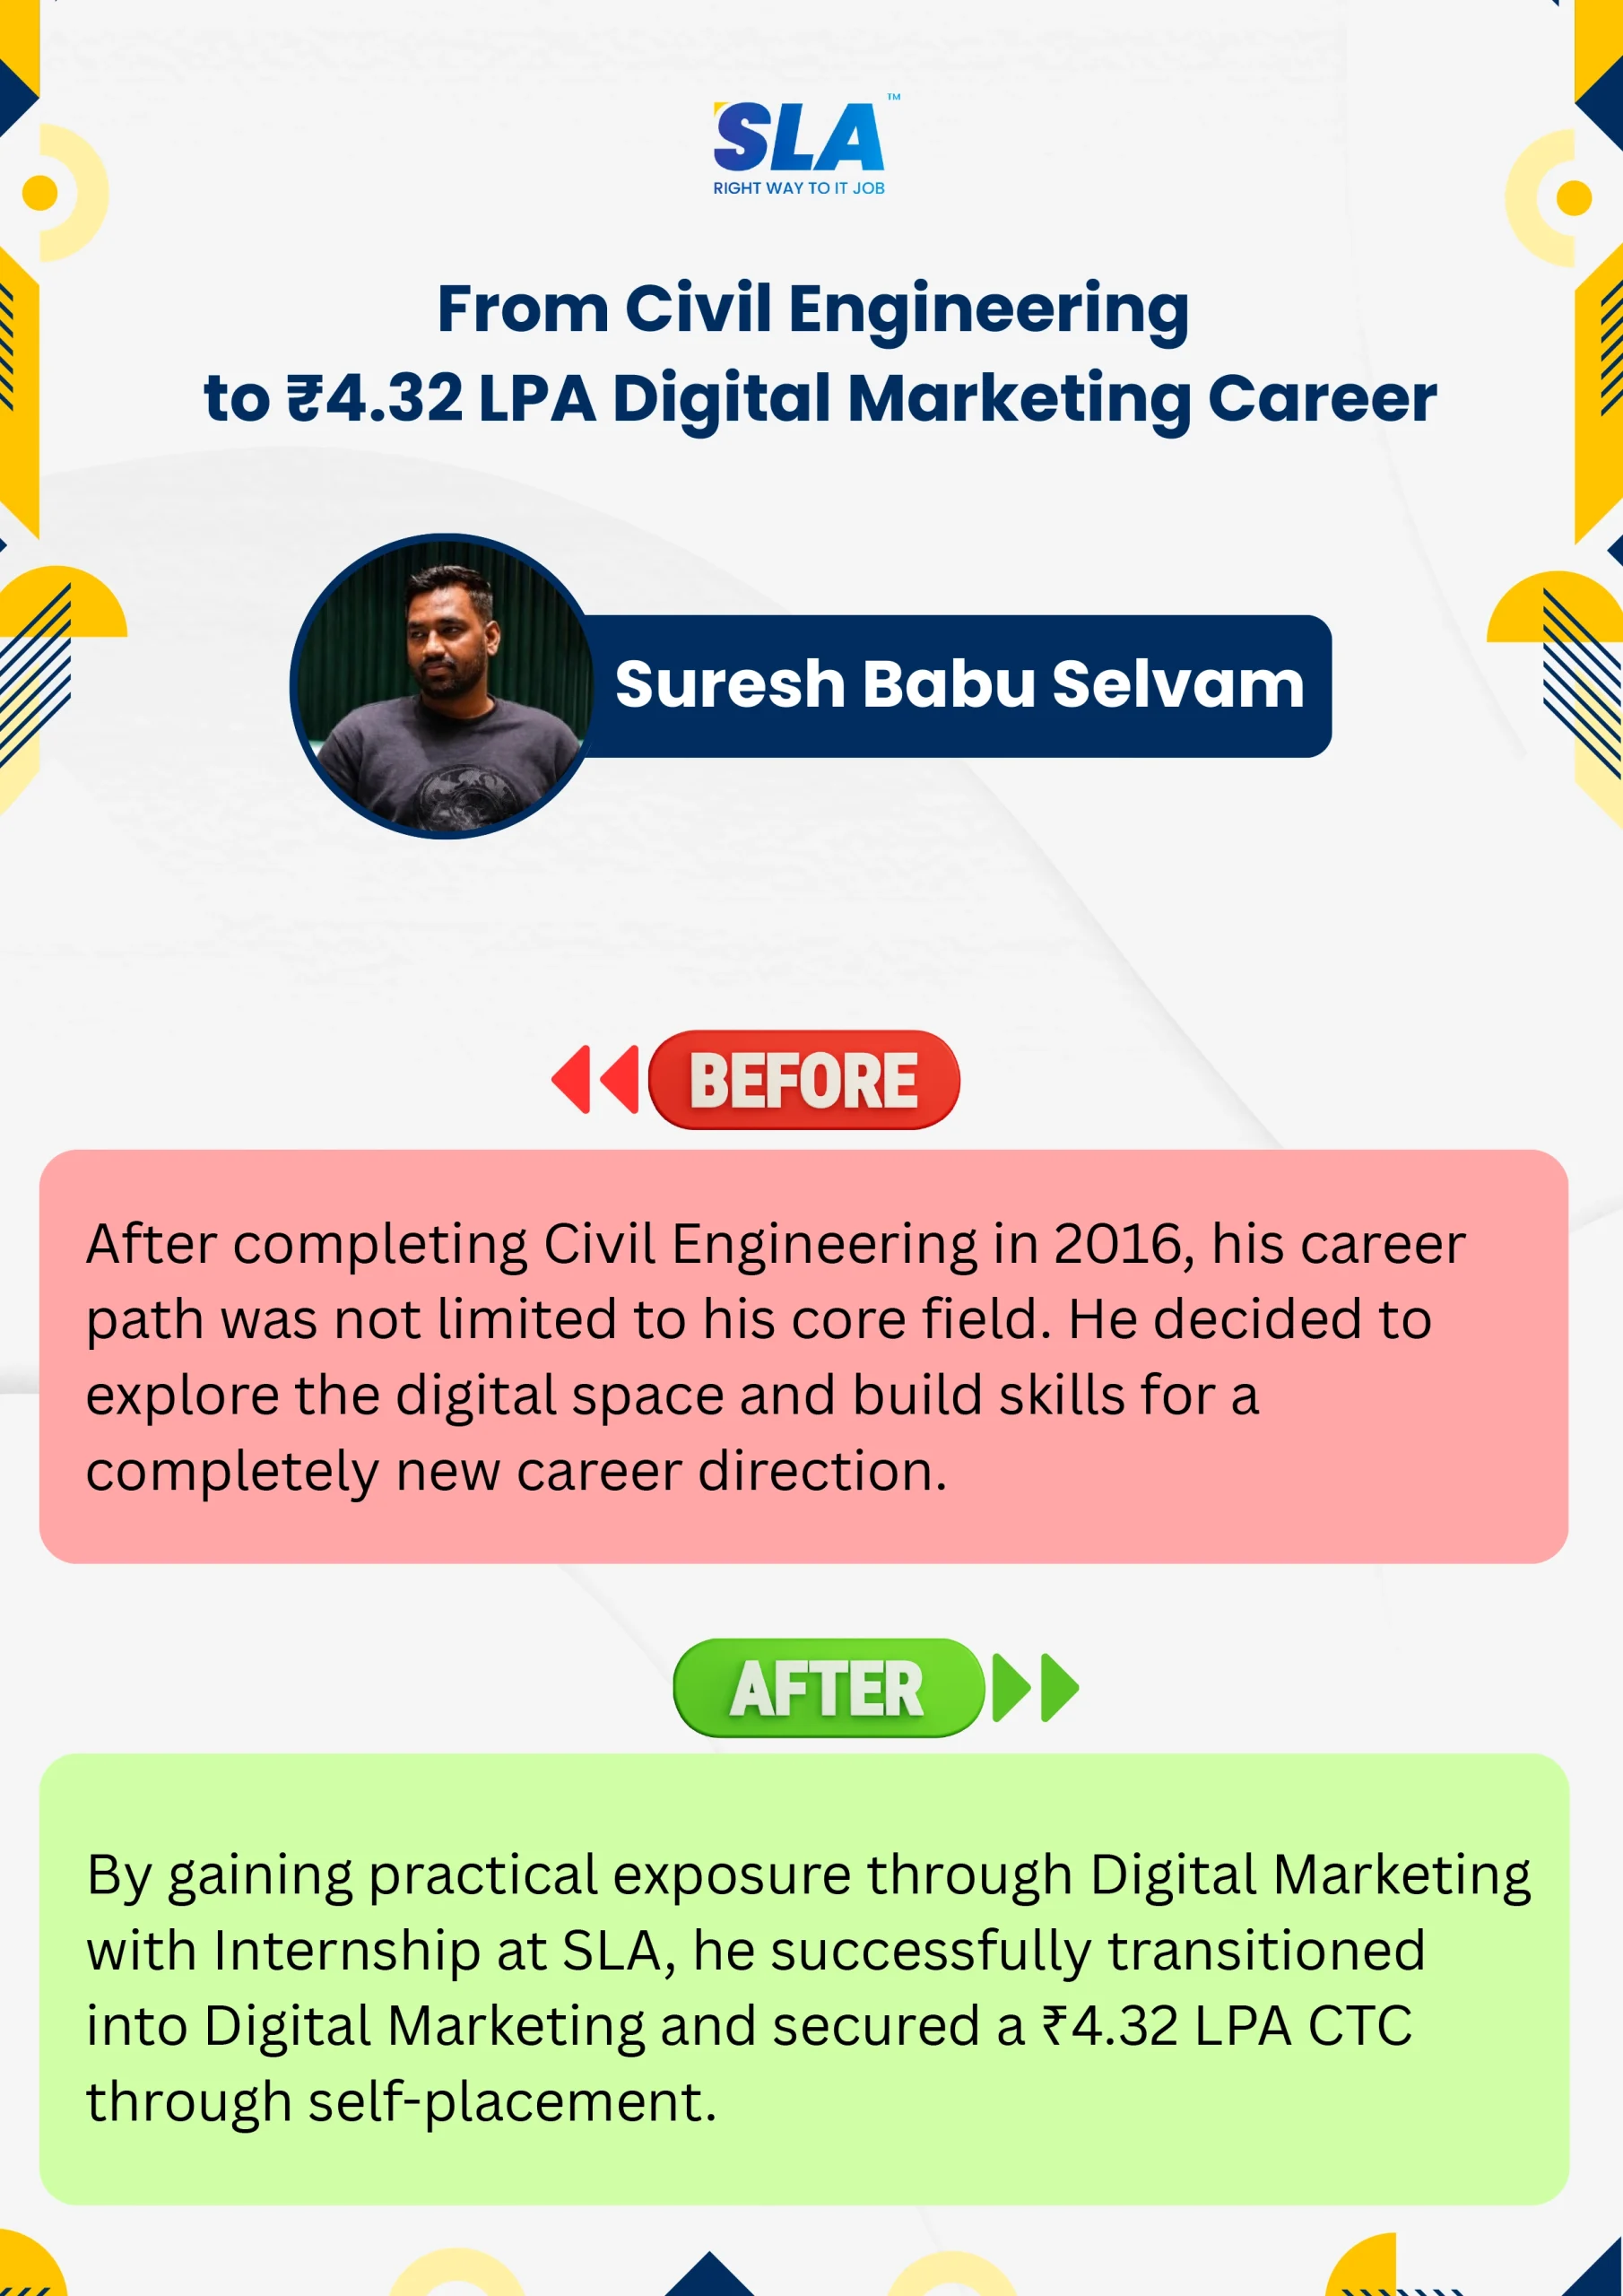
Life Changing Stories

Explore Our Students' Inspiring Leap Stories!

See More Success Stories

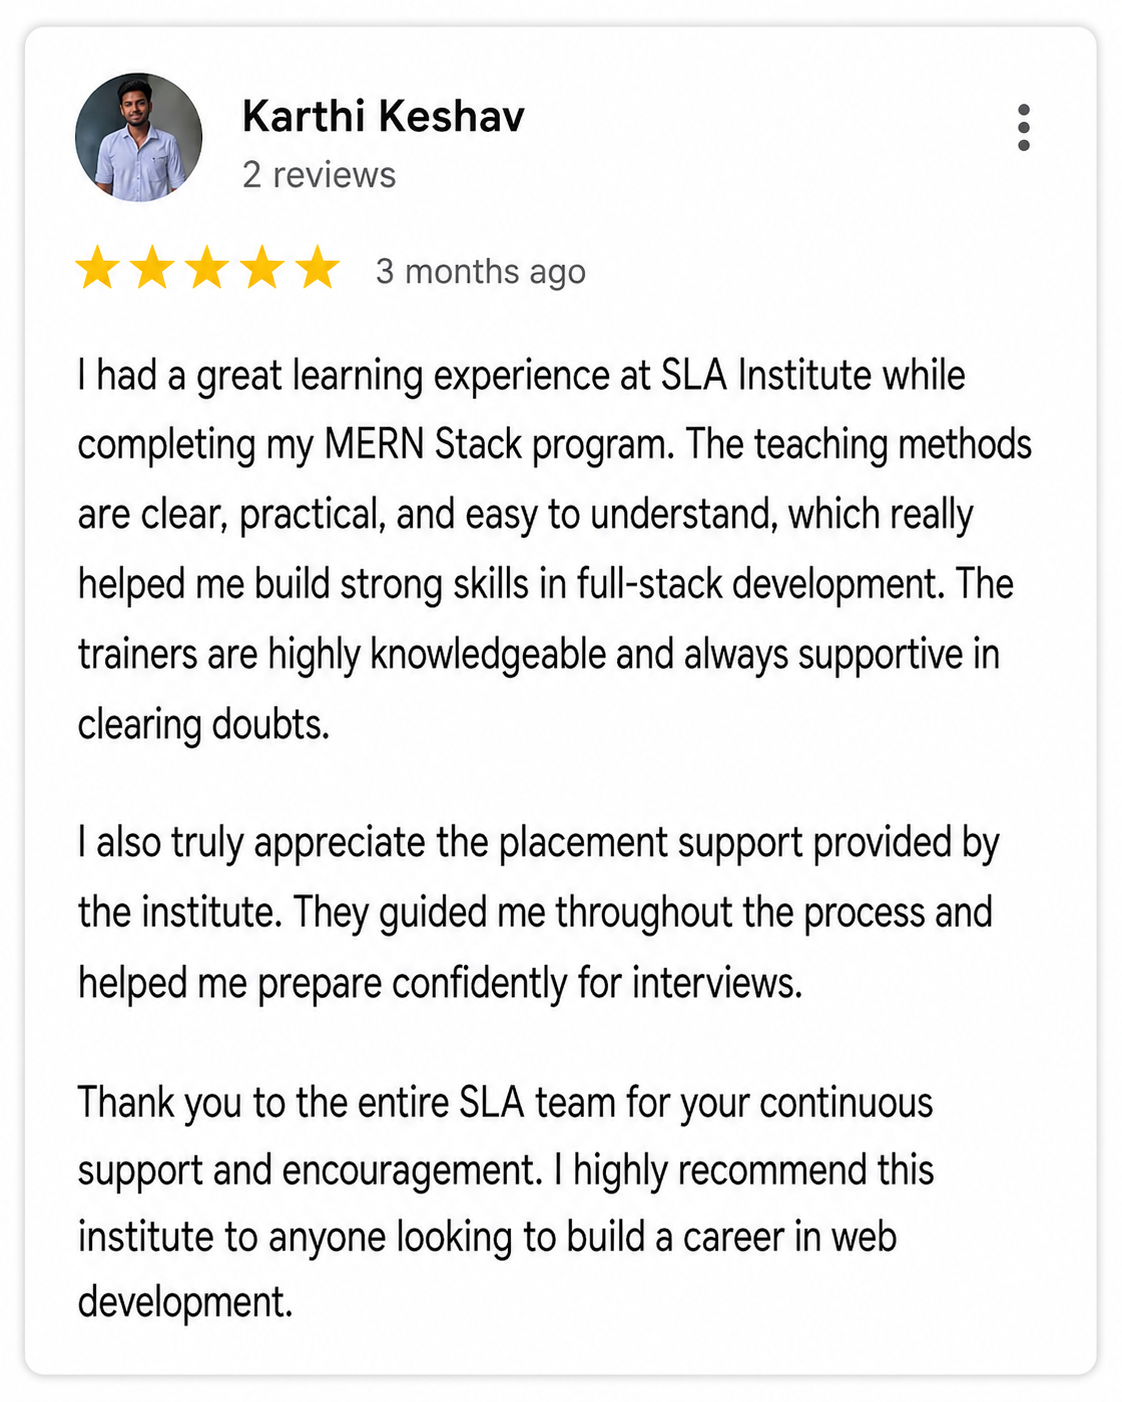
Check our Google Reviews

3D Coverflow Carousel
Review Image
Click here to view all Reviews

Syllabus of Data Science Course For Beginners

Download Syllabus
  • Introduction to Data Analytics
  • Introduction to Business Analytics
  • Understanding Business Applications
  • Data types and data Models
  • Type of Business Analytics
  • Evolution of Analytics
  • Data Science Components
  • Data Scientist Skillset
  • Univariate Data Analysis
  • Introduction to Sampling
  • Introduction to R programming
  • Types of Objects in R
  • Naming standards in R
  • Creating Objects in R
  • Data Structure in R
  • Matrix, Data Frame, String, Vectors
  • Understanding Vectors & Data input in R
  • Lists, Data Elements
  • Creating Data Files using R
  • Basic Operations in R – Expressions, Constant Values, Arithmetic, Function Calls, Symbols
  • Sub-setting Data
  • Selecting (Keeping) Variables
  • Excluding (Dropping) Variables
  • Selecting Observations and Selection using Subset Function
  • Merging Data
  • Sorting Data
  • Adding Rows
  • Visualization using R
  • Data Type Conversion
  • Built-In Numeric Functions
  • Built-In Character Functions
  • User Built Functions
  • Control Structures
  • Loop Functions
  • Basic Statistics
  • Measure of central tendency
  • Types of Distributions
  • Anova
  • F-Test
  • Central Limit Theorem & applications
  • Types of variables
  • Relationships between variables
  • Central Tendency
  • Measures of Central Tendency
  • Kurtosis
  • Skewness
  • Arithmetic Mean / Average
  • Merits & Demerits of Arithmetic Mean
  • Mode, Merits & Demerits of Mode
  • Median, Merits & Demerits of Median
  • Range
  • Concept of Quantiles, Quartiles, percentile
  • Standard Deviation
  • Variance
  • Calculate Variance
  • Covariance
  • Correlation
  • Hypothesis Testing
  • Multiple Linear Regression
  • Logistic Regression
  • Market Basket Analysis
  • Clustering (Hierarchical Clustering & K-means Clustering)
  • Classification (Decision Trees)
  • Time Series Analysis (Simple Moving Average, Exponential smoothing, ARIMA+)
  • Standard Normal Distribution
  • Normal Distribution
  • Geometric Distribution
  • Poisson Distribution
  • Binomial Distribution
  • Parameters vs. Statistics
  • Probability Mass Function
  • Random Variable
  • Conditional Probability and Independence
  • Unions and Intersections
  • Finding Probability of dataset
  • Probability Terminology
  • Probability Distributions
  • Bubble Chart
  • Sparklines
  • Waterfall chart
  • Box Plot
  • Line Charts
  • Frequency Chart
  • Bimodal & Multimodal Histograms
  • Histograms
  • Scatter Plot
  • Pie Chart
  • Bar Graph
  • Line Graph
  • Overview & Terminologies
  • What is Machine Learning?
  • Why Learn?
  • When is Learning required?
  • Data Mining
  • Application Areas and Roles
  • Types of Machine Learning
  • Supervised Learning
  • Unsupervised Learning
  • Reinforcement learning

Steps in developing a Machine Learning application

  • Key tasks of Machine Learning
  • Modelling Terminologies
  • Learning a Class from Examples
  • Probability and Inference
  • PAC (Probably Approximately Correct) Learning
  • Noise
  • Noise and Model Complexity
  • Triple Trade-Off
  • Association Rules
  • Association Measures
  • Concept of Regression
  • Best Fitting line
  • Simple Linear Regression
  • Building regression models using excel
  • Coefficient of determination (R- Squared)
  • Multiple Linear Regression
  • Assumptions of Linear Regression
  • Variable transformation
  • Reading coefficients in MLR
  • Multicollinearity
  • VIF
  • Methods of building Linear regression model in R
  • Model validation techniques
  • Cooks Distance
  • Q-Q Plot
  • Durbin- Watson Test
  • Kolmogorov-Smirnof Test
  • Homoskedasticity of error terms
  • Logistic Regression
  • Applications of logistic regression
  • Concept of odds
  • Concept of Odds Ratio
  • Derivation of logistic regression equation
  • Interpretation of logistic regression output
  • Model building for logistic regression
  • Model validations
  • Confusion Matrix
  • Concept of ROC/AOC Curve
  • KS Test
  • Applications of Market Basket Analysis
  • What is association Rules
  • Overview of Apriori algorithm
  • Key terminologies in MBA
  • Support
  • Confidence
  • Lift
  • Model building for MBA
  • Transforming sales data to suit MBA
  • MBA Rule selection
  • Ensemble modelling applications using MBA
  • Model building using ARIMA, ARIMAX, SARIMAX
  • Data De-trending & data differencing
  • KPSS Test
  • Dickey Fuller Test
  • Concept of stationarity
  • Model building using exponential smoothing
  • Model building using simple moving average
  • Time series analysis techniques
  • Components of time series
  • Prerequisites for time series analysis
  • Concept of Time series data
  • Applications of Forecasting
  • Understanding the Concept
  • Internal decision nodes
  • Terminal leaves.
  • Tree induction: Construction of the tree
  • Classification Trees
  • Entropy
  • Selecting Attribute
  • Information Gain
  • Partially learned tree
  • Overfitting
  • Causes for over fitting
  • Overfitting Prevention (Pruning) Methods
  • Reduced Error Pruning
  • Decision trees – Advantages & Drawbacks
  • Ensemble Models
  • Parametric Methods Recap
  • Clustering
  • Direct Clustering Method
  • Mixture densities
  • Classes v/s Clusters
  • Hierarchical Clustering
  • Dendogram interpretation
  • Non-Hierarchical Clustering
  • K-Means
  • Distance Metrics
  • K-Means Algorithm
  • K-Means Objective
  • Color Quantization
  • Vector Quantization
  • Tableau Introduction
  • Data connection to Tableau
  • Calculated fields, hierarchy, parameters, sets, groups in Tableau
  • Various visualizations Techniques in Tableau
  • Map based visualization using Tableau
  • Reference Lines
  • Adding Totals, sub totals, Captions
  • Advanced Formatting Options
  • Using Combined Field
  • Show Filter & Use various filter options
  • Data Sorting
  • Create Combined Field
  • Table Calculations
  • Creating Tableau Dashboard
  • Action Filters
  • Creating Story using Tableau
  • Clustering using Tableau
  • Time series analysis using Tableau
  • Simple Linear Regression using Tableau
  • Integrating R code with Tableau
  • Creating statistical model with dynamic inputs
  • Visualizing R output in Tableau
  • Case Study 1- Real time project with Twitter Data Analytics
  • Case Study 2- Real time project with Google Finance
  • Case Study 3- Real time project with IMDB Website

Objectives of Data Science Course For Beginners

The Data Science Training will cover all the topics ranging from fundamental to advanced concepts, which will make it easy for students to grasp Data Science. The Data Science Course Curriculum is composed of some of the most useful and rare concepts that will surely give students a complete understanding of Data Science as well. So, some of those curriculum are discussed below as objectives:

  • To make students well-versed with fundamental concepts of Data Science like – Introduction to Business Analytics, Basic Operations in R Programming, Introduction to Statistics etc.
  • To make students more aware of Data Science by making them learn concepts like – Data Visualization Techniques, Machine Learning, Regression Techniques, Market Basket Analysis etc.
  • To make students knowledgeable in advanced Data Science like – Time Series Analysis, Decision Trees using R, Tableau Analytics, R Integration in Tableau etc.
Click Here to Get Started

Highlights of Data Science Course For Beginners?

Data science integrates various techniques and methods to derive insights from data. It involves collecting, cleaning, and analyzing data, using statistical and machine learning methods, and creating visual representations. Key objectives include predicting trends, summarizing past data, recommending actions, and understanding causes. Applied across sectors like healthcare, finance, and retail, data science drives decision-making and solves complex problems.

A Data Science Full Stack encompasses all tools, techniques, and technologies needed for a complete data science project, from data acquisition to application deployment. It includes data collection, storage, cleaning, and preprocessing, as well as exploratory analysis, statistical modeling, machine learning, and visualization. Additionally, it covers big data technologies, deployment, and ongoing monitoring to ensure a comprehensive data workflow.

The following are the reasons for learning Data Science:

  • Job Market: Skills in data science are highly sought after in various industries such as technology, finance, healthcare, and marketing.
  • Diverse Roles: Career paths vary from data analyst to machine learning engineer, providing multiple job options.
  • Informed Choices: Data science helps organizations make evidence-based decisions, enhancing efficiency and strategic planning.
  • Competitive Edge: Businesses use data insights to gain a market advantage.

The following are the prerequisites for learning Data Science:

  • Statistics: Knowledge of statistical methods, including probability, distributions, hypothesis testing, and regression.
  • Python: Proficiency in Python, a key language in data science due to libraries like Pandas, NumPy, and Scikit-learn.
  • Data Manipulation: Skills in data cleaning and manipulation with tools such as Pandas or Excel.
  • Relational Databases: Knowledge of SQL and database concepts like tables, joins, and indexing.

Our Data Science Course Fees may vary depending on the specific course program you choose (basic / intermediate / full stack), course duration, and course format (remote or in-person). On an average the Data Science Course Fees range from 30k to 40k, for a duration of 3 months with international certification based on the above factors.

The following are the jobs related to Data Science:

  • Data Scientist
  • Data Analyst
  • Data Engineer
  • Machine Learning Engineer
  • Business Intelligence Analyst
  • Quantitative Analyst
  • Data Architect
  • Research Scientist

The following are the Data Science real-time applications:

  • Fraud Detection
  • Recommendation System
  • Predictive Maintenance
  • Dynamic Pricing
  • Real-time Analytics and Dashboard
  • Traffic Management and Navigation
  • Social Media Monitoring

Boost your skills with Data Science Course For Beginners with Experts

Our Mentors are from Top Companies like:
  • Experienced and dedicated Data Science trainers excel in teaching students across all skill levels about Data Science principles.
  • They are skilled in programming languages such as R, Python, and Scala, which they use for data analysis, predictive modeling, and creating visualizations.
  • Their expertise includes a thorough understanding of machine learning algorithms like Linear Regression, Logistic Regression, Random Forests, Gradient Boosting, and various clustering techniques.
  • They are adept at building predictive models using both regression and classification methods.
  • They have practical experience with SQL, NoSQL, and big-data technologies, enabling them to develop powerful data pipelines.
  • They effectively use visualization tools such as Tableau, Power BI, and Google Data Studio to create engaging visual representations for business insights.
  • They possess a deep comprehension of real-world data analysis scenarios and emphasize the importance of advanced data interpretation.
  • They motivate and guide students in applying Data Science techniques to tackle business challenges, especially within Data Science Training.
  • They stay current with industry trends and advancements, continually updating their knowledge and teaching methods.
  • They instruct students in using both industry-standard and open-source tools for various Data Science tasks, focusing on practical projects and assignments.
  • They are proficient in teaching core statistics and mathematics concepts through hands-on problem-solving approaches.
  • They foster strong, supportive relationships with students, providing motivation and assistance in complex tasks, assignments, resume building, and interview preparation.
Click Here to Get Started

Explore Real Projects Built by Softlogic Students

Explore the real-world, enterprise-level projects designed and executed by our successful alumni. Gain the same hands-on exposure to live industry projects, build a standout portfolio, and prove your practical skills to top hiring managers instantly.
Dynamic Pricing Model
Churn Prediction Model
Image Classification with Deep Learning
Project Practices for Data Science Course For Beginners

Why Softlogic Systems is the Best Choice for Data Science Course For Beginners

Crowdfunding Platform
Online & Offline Training Options
Learn at your convenience with flexible classroom and live online training.
Learn from 100+ Real-Time Developers
Get trained by industry professionals with years of hands-on experience.
Voting System with Python Django
Hands-on Projects & Codeathons
Practice with real-time projects and coding challenges to build confidence.
0% EMI Fee Options
Pay your course fees flexibly with easy EMI plans at zero interest.
Resume & Interview Support
Get expert help with resume building, mock interviews, and soft skills.
Placement with Top IT Firms
Access placement opportunities with leading MNCs and IT companies.
500+ Hiring Partners
Benefit from Softlogic’s strong recruiter network for faster job placement.
No Backdoor Jobs
We ensure only genuine placement opportunities with trusted companies.
Request a Free Callback

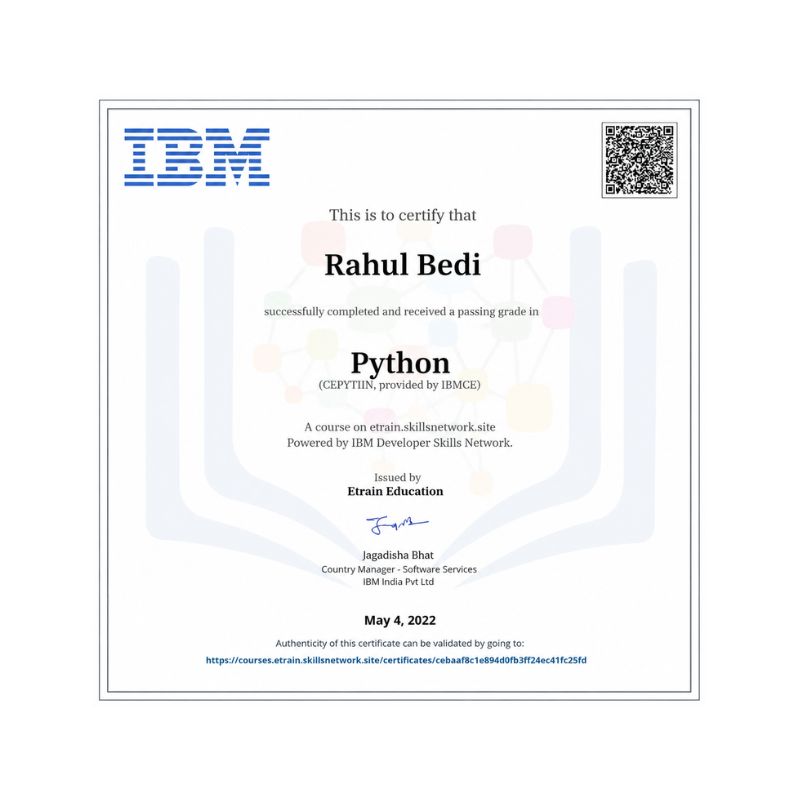
Certifications

Earn Your Certificate of Completion
Validate your achievements with Softlogic's Certificate of Completion, verifying successful fulfillment of all essential components.
Take Your Career to the Next Level with  Certifications
Get a certifications through our training programs to gain a competitive edge in the industry.
Stand Out from the Crowd with Codethon Certificate
Verify the authenticity of your real-time projects with Softlogic's Codethon certificate.

The Global Edge: Certified Vs. Uncertified

With Global Certification

  • ✅ Visibility in ATS Filters
  • ✅Command Higher Hikes
  • ✅ Verified Skill Proof
  • ✅Global Job Access
  • ✅ Fast-Tracked Senior Roles

Without Global Certification

  • ❌ Stuck in Screening
  • ❌ Lower Starting Pay
  • ❌ Unproven Technical Ability
  • ❌ Limited Local Scope
  • ❌ Slower Career Leader
  •  
Let's take the First Step to a better future! GET Free Career Guidance
The SLA Way to Get Placed

The SLA Way to Get Placed

Seven connected stages, one continuous path from enrollment to your career launch — here is exactly how it works, step by step.

01
🎓

Technical Mastery

Industry-aligned curriculum, daily coding tasks, real-time projects

02
💻

Career Readiness

Aptitude, Communication, ATS-friendly resume optimization

03
🎯

Placement Prep

Aptitude, communication tuning and technical interview mastery.

04
💬

Panel Mock Interviews

Real company-pattern mocks with expert panel feedback.

05
👨‍💼

Interview schedule

Multiple company drives with lifetime placement support.

06
📝

Interview Feedback

Detailed performance analysis and one-on-one guidance.

07
🏆

Launch Your Career

Land your first job with lifetime alumni and career support.

Listen to Our Students' Video Testimonials

FAQ

Python and R are the main programming languages used in Data Science. Python is popular due to its ease of use, rich ecosystem of libraries (like Pandas, NumPy, and Scikit-learn), and flexibility. R is recognized for its robust statistical analysis features and is widely used in academic and research settings.

Missing data can be managed through various approaches, including imputation (substituting missing values with mean, median, or mode), utilizing algorithms designed to handle missing data, or by excluding records or features with missing values. The choice of method depends on the extent and nature of the missing data.

Supervised learning involves training models on datasets with labeled responses, aiming to predict outcomes for new, unseen data. In contrast, unsupervised learning involves working with unlabeled data to uncover hidden patterns or groupings.

Feature engineering is the process of creating or modifying features to enhance a machine learning model’s performance. It is vital because the effectiveness of features directly influences the accuracy and efficiency of the model.

For classification tasks, metrics such as accuracy, precision, recall, F1 score, and ROC-AUC are commonly used. For regression tasks, metrics like mean squared error (MSE), mean absolute error (MAE), and R-squared are often employed.

To evaluate model performance, relevant metrics (for classification or regression) are used, along with cross-validation to ensure the model generalizes well to new data. Additionally, examining residuals or errors can help understand the model’s limitations.

Hyperparameter tuning involves adjusting the settings of a machine learning algorithm that are not learned from the data but are predefined before training (such as learning rate or the number of trees in a forest). The objective is to identify the optimal set of hyperparameters to enhance model performance.

Big data technologies such as Hadoop and Spark are designed to handle and analyze large-scale datasets efficiently. Hadoop provides a framework for distributed storage and processing, while Spark offers rapid, in-memory data processing capabilities, which are crucial for managing extensive data volumes.

The corporate office of the Softlogic Systems is located at K.K.Nagar.

Softlogic accepts a wide range of payment methods, including:

  • Cash
  • Debit cards
  • Credit cards (MasterCard, Visa, Maestro)
  • Net banking
  • UPI
  • Including EMI

Related Blogs

Our counselors will share the Syllabus PDF with you via Email / Whatsapp

Get Your Instant Job & Placement Eligibility
Report in Just 30 Seconds!

We are excited to get started with you

Give us your information and we will arange for a free call (at your convenience) with one of our counsellors. You can get all your queries answered before deciding to join SLA and move your career forward.