Start your journey to an IT career with practical and focused training in the industry. This training program is great for beginners. It helps you learn important topics like Python, SQL, Excel, Machine Learning, Data Visualization, and Artificial Intelligence. This Course is designed for students, freshers, and working professionals. It helps you develop strong technical and problem-solving skills in a simple, easy-to-understand way. You will get help from trainers, guidance that is step by step, and help to get a job, and our Data Science Course in Bangalore will help you get the confidence and knowledge you need to look for good jobs in the field of data science and analytics, which is growing very fast.
Data Science Training In Bangalore
4.60
(1538)
DURATION
3 Months
EMI
0% Interest
Mode
Live Online / Offline
Let's take the first step to becoming an expert in Data Science
Click Here to Get Started
100% Placement
Assurance
Get Certified
JOB PLACEMENT ELIGIBILITY TEST
×
Your Placement Eligibility Report
Want more details about Data Science Course?
Fill out the form, and our counsellors will get in touch with you at your preferred time. You can have all your queries answered. Once you decide that SLA is the perfect fit for your training needs, our counselors will guide you through the process every step of the way.
Course Schedules
Course Syllabus
Course Fees
or any other questions...
Fees, Duration & Batch Timings for Data Science Course
Hands On Training
3-5 Real Time Projects
60-100 Practical Assignments
3+ Assessments / Mock Interviews
June 2026
Week days
(Mon-Fri)
Online/Offline
2 Hours Real Time Interactive Technical Training
1 Hour Aptitude
1 Hour Communication & Soft Skills
(Suitable for Fresh Jobseekers / Non IT to IT transition)
Course Fee
June 2026
Week ends
(Sat-Sun)
Online/Offline
4 Hours Real Time Interactive Technical Training
(Suitable for working IT Professionals)
Course Fee
Save up to 20% in your Course Fee on our Job Seeker Course Series
Learn More
Syllabus of Data Science Course
Download Syllabus
Introduction
- Introduction to Data Analytics
- Introduction to Business Analytics
- Understanding Business Applications
- Data types and data Models
- Type of Business Analytics
- Evolution of Analytics
- Data Science Components
- Data Scientist Skillset
- Univariate Data Analysis
- Introduction to Sampling
Basic Operations in R Programming
- Introduction to R programming
- Types of Objects in R
- Naming standards in R
- Creating Objects in R
- Data Structure in R
- Matrix, Data Frame, String, Vectors
- Understanding Vectors & Data input in R
- Lists, Data Elements
- Creating Data Files using R
Data Handling in R Programming
- Basic Operations in R – Expressions, Constant Values, Arithmetic, Function Calls, Symbols
- Sub-setting Data
- Selecting (Keeping) Variables
- Excluding (Dropping) Variables
- Selecting Observations and Selection using Subset Function
- Merging Data
- Sorting Data
- Adding Rows
- Visualization using R
- Data Type Conversion
- Built-In Numeric Functions
- Built-In Character Functions
- User Built Functions
- Control Structures
- Loop Functions
Introduction to Statistics
- Basic Statistics
- Measure of central tendency
- Types of Distributions
- Anova
- F-Test
- Central Limit Theorem & applications
- Types of variables
- Relationships between variables
- Central Tendency
- Measures of Central Tendency
- Kurtosis
- Skewness
- Arithmetic Mean / Average
- Merits & Demerits of Arithmetic Mean
- Mode, Merits & Demerits of Mode
- Median, Merits & Demerits of Median
- Range
- Concept of Quantiles, Quartiles, percentile
- Standard Deviation
- Variance
- Calculate Variance
- Covariance
- Correlation
Introduction to Statistics – 2
- Hypothesis Testing
- Multiple Linear Regression
- Logistic Regression
- Market Basket Analysis
- Clustering (Hierarchical Clustering & K-means Clustering)
- Classification (Decision Trees)
- Time Series Analysis (Simple Moving Average, Exponential smoothing, ARIMA+)
Introduction to Probability
- Standard Normal Distribution
- Normal Distribution
- Geometric Distribution
- Poisson Distribution
- Binomial Distribution
- Parameters vs. Statistics
- Probability Mass Function
- Random Variable
- Conditional Probability and Independence
- Unions and Intersections
- Finding Probability of dataset
- Probability Terminology
- Probability Distributions
Data Visualization Techniques
- Bubble Chart
- Sparklines
- Waterfall chart
- Box Plot
- Line Charts
- Frequency Chart
- Bimodal & Multimodal Histograms
- Histograms
- Scatter Plot
- Pie Chart
- Bar Graph
- Line Graph
Introduction to Machine Learning
- Overview & Terminologies
- What is Machine Learning?
- Why Learn?
- When is Learning required?
- Data Mining
- Application Areas and Roles
- Types of Machine Learning
- Supervised Learning
- Unsupervised Learning
- Reinforcement learning
Machine Learning Concepts & Terminologies
Steps in developing a Machine Learning application
- Key tasks of Machine Learning
- Modelling Terminologies
- Learning a Class from Examples
- Probability and Inference
- PAC (Probably Approximately Correct) Learning
- Noise
- Noise and Model Complexity
- Triple Trade-Off
- Association Rules
- Association Measures
Regression Techniques
- Concept of Regression
- Best Fitting line
- Simple Linear Regression
- Building regression models using excel
- Coefficient of determination (R- Squared)
- Multiple Linear Regression
- Assumptions of Linear Regression
- Variable transformation
- Reading coefficients in MLR
- Multicollinearity
- VIF
- Methods of building Linear regression model in R
- Model validation techniques
- Cooks Distance
- Q-Q Plot
- Durbin- Watson Test
- Kolmogorov-Smirnof Test
- Homoskedasticity of error terms
- Logistic Regression
- Applications of logistic regression
- Concept of odds
- Concept of Odds Ratio
- Derivation of logistic regression equation
- Interpretation of logistic regression output
- Model building for logistic regression
- Model validations
- Confusion Matrix
- Concept of ROC/AOC Curve
- KS Test
Market Basket Analysis
- Applications of Market Basket Analysis
- What is association Rules
- Overview of Apriori algorithm
- Key terminologies in MBA
- Support
- Confidence
- Lift
- Model building for MBA
- Transforming sales data to suit MBA
- MBA Rule selection
- Ensemble modelling applications using MBA
Time Series Analysis (Forecasting)
- Model building using ARIMA, ARIMAX, SARIMAX
- Data De-trending & data differencing
- KPSS Test
- Dickey Fuller Test
- Concept of stationarity
- Model building using exponential smoothing
- Model building using simple moving average
- Time series analysis techniques
- Components of time series
- Prerequisites for time series analysis
- Concept of Time series data
- Applications of Forecasting
Decision Trees using R
- Understanding the Concept
- Internal decision nodes
- Terminal leaves.
- Tree induction: Construction of the tree
- Classification Trees
- Entropy
- Selecting Attribute
- Information Gain
- Partially learned tree
- Overfitting
- Causes for over fitting
- Overfitting Prevention (Pruning) Methods
- Reduced Error Pruning
- Decision trees – Advantages & Drawbacks
- Ensemble Models
K Means Clustering
- Parametric Methods Recap
- Clustering
- Direct Clustering Method
- Mixture densities
- Classes v/s Clusters
- Hierarchical Clustering
- Dendogram interpretation
- Non-Hierarchical Clustering
- K-Means
- Distance Metrics
- K-Means Algorithm
- K-Means Objective
- Color Quantization
- Vector Quantization
Tableau Analytics
- Tableau Introduction
- Data connection to Tableau
- Calculated fields, hierarchy, parameters, sets, groups in Tableau
- Various visualizations Techniques in Tableau
- Map based visualization using Tableau
- Reference Lines
- Adding Totals, sub totals, Captions
- Advanced Formatting Options
- Using Combined Field
- Show Filter & Use various filter options
- Data Sorting
- Create Combined Field
- Table Calculations
- Creating Tableau Dashboard
- Action Filters
- Creating Story using Tableau
Analytics using Tableau
- Clustering using Tableau
- Time series analysis using Tableau
- Simple Linear Regression using Tableau
R integration in Tableau
- Integrating R code with Tableau
- Creating statistical model with dynamic inputs
- Visualizing R output in Tableau
- Case Study 1- Real time project with Twitter Data Analytics
- Case Study 2- Real time project with Google Finance
- Case Study 3- Real time project with IMDB Website
Objectives of Data Science Training
This training program helps you build technical and analytical skills. You learn by doing projects and industry-focused exercises. Our Data Science Course in Bangalore teaches you concepts from beginner to advanced levels in a simple way.
Beginner Level
At this level, people learn the basics of Data Science. They learn about Python, SQL, and Excel. They also learn about data analysis concepts. This level is great for beginners because it is simple and easy to follow.
Intermediate Level
Now people learn about Machine Learning, how to make pictures with data, and how to use numbers to understand things. People get to practice and work on projects and data, so they get a lot of experience.
Advanced Level
At this level, people learn about hard things like Deep Learning, Artificial Intelligence, and how to predict what will happen. This level helps people get really good at solving problems and gets them ready to work on problems in the Data Science field.
Why Softlogic Systems is the Best Choice for Data Science Training – Learn, Practice, and Get Placed!
Online & Offline Training Options
Learn at your convenience with flexible classroom and live online training.
Learn from 100+ Real-Time Developers
Get trained by industry professionals with years of hands-on experience.
Hands-on Projects & Codeathons
Practice with real-time projects and coding challenges to build confidence.
0% EMI Fee Options
Pay your course fees flexibly with easy EMI plans at zero interest.
Resume & Interview Support
Get expert help with resume building, mock interviews, and soft skills.
Placement with Top IT Firms
Access placement opportunities with leading MNCs and IT companies.
1000+ Hiring Partners
Benefit from Softlogic’s strong recruiter network for faster job placement.
No Backdoor Jobs
We ensure only genuine placement opportunities with trusted companies.
Want to Speak to a Trainer about Data Science?Request a Free Callback
Highlights of Data Science Course
Who is eligible to join the Data Science course?
The Data Science course is for students, freshers, working professionals, and career switchers who are interested in Data Science. You do not need to know a lot about technology to join the Data Science course. The Data Science course is open to everyone.
What skills are covered in the course?
In the Data Science course, you will learn Python, SQL, Machine Learning, Data Visualization, Excel, Artificial Intelligence, and other important Data Science skills. You will get to practice what you learn in the Data Science course.
Is the course beginner-friendly?
Yes, the Data Science course is beginner-friendly. The Data Science course has explanations, structured learning modules, and hands-on practice sessions. This makes it easy to understand the Data Science course.
Does the training include real-time projects?
Yes, the Data Science course includes real-time projects and case studies. These real-time projects and case studies will help you learn how to solve problems in the Data Science field.
Is placement support provided after training?
Yes, after you finish the Data Science course, you will get help finding a job. This includes help with your resume and interview practice. Finding job opportunities in the IT field with the Data Science course.
What is the duration of the Data Science course?
The length of the Data Science course depends on what level you are at and how you want to learn. The Data Science course can be a few weeks. A few months long.
Is certification provided after course completion?
Yes, you will get a certificate after completing the Data Science course. This certificate will show that you have finished the Data Science course.
What makes this Data Science course valuable?
The Data Science course is valuable because it provides focused industry training, practical learning, support from trainers, real-time projects, and help with career development. All these things will help to develop skills in the Data Science field. The Data Science course will help you learn a lot about Data Science.
Boost Your Skills with Our Data Science Training Experts
Our Mentors are from Top Companies like:
Want to Speak to a Trainer about Data Science?Request a Free Callback
What Modes of Training are available for Data Science Course?
Offline / Classroom Training

A Personalized Learning Experience with Direct Trainer Engagement!
- Direct Interaction with the Trainer
- Clarify doubts then and there
- Airconditioned Premium Classrooms and Lab with all amenities
- Codeathon Practices
- Direct Aptitude Training
- Live Interview Skills Training
- Direct Panel Mock Interviews
- Campus Drives
- 100% Placement Support
Online Training

Instructor Led Live Training! Learn at the comfort of your home
- No Recorded Sessions
- Live Virtual Interaction with the Trainer
- Clarify doubts then and there virtually
- Live Virtual Interview Skills Training
- Live Virtual Aptitude Training
- Online Panel Mock Interviews
- 100% Placement Support
Corporate Training

Blended Delivery model (both Online and Offline as per Clients’ requirement)
- Industry endorsed Skilled Faculties
- Flexible Pricing Options
- Customized Syllabus
- 12X6 Assistance and Support
Want to Master your Skills in Data Science?GET Free Consultation
Certifications
Take your career to new heights with Softlogic's software training certifications.
Improve your abilities to get access to rewarding possibilities
Improve your abilities to get access to rewarding possibilities
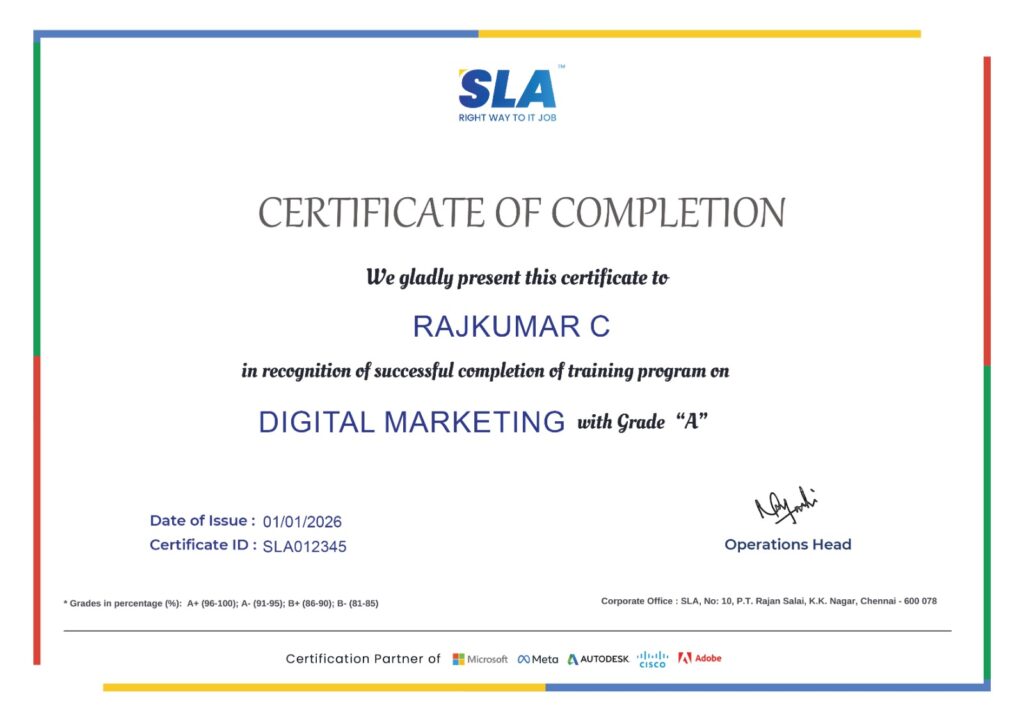
Earn Your Certificate of Completion
Validate your achievements with Softlogic's Certificate of Completion, verifying successful fulfillment of all essential components.
Take Your Career to the Next Level with Certifications
Get a certifications through our training programs to gain a competitive edge in the industry.
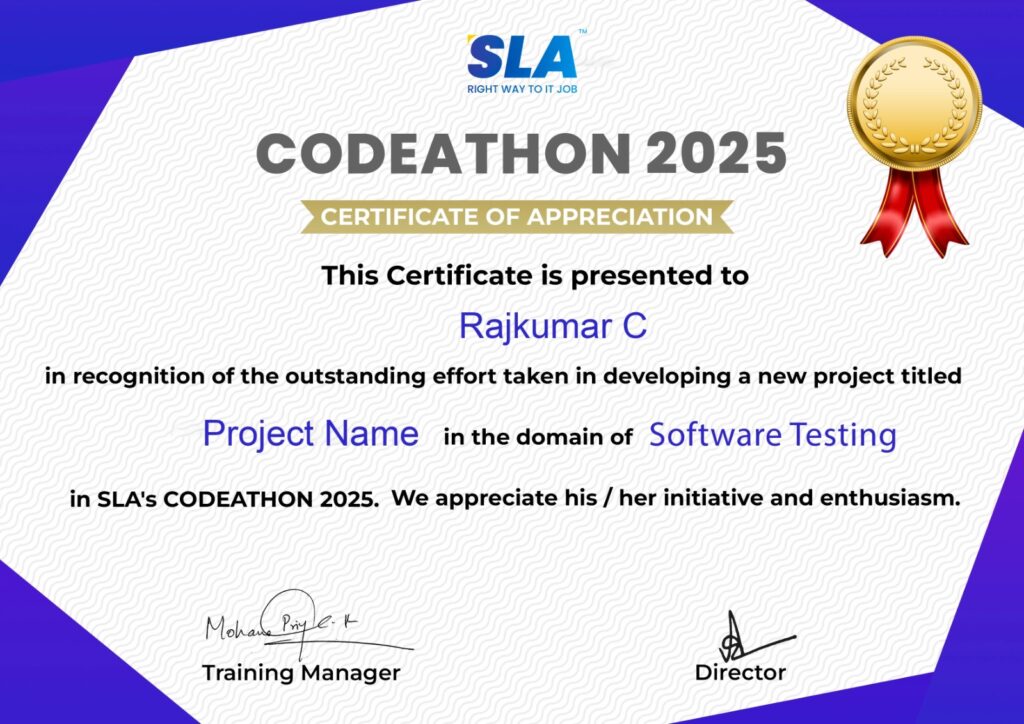
Stand Out from the Crowd with Codethon Certificate
Verify the authenticity of your real-time projects with Softlogic's Codethon certificate.
Hands-on Project Practices in Data Science Course
Traffic and Weather Prediction
Online Fraud Detection
AI Customer Support Chatbot
Social Media Sentiment Analysis
Product Recommendation Engine
Disease Prediction System
Stock Market Prediction
Fake News Detection
AI Resume Screening System
The SLA Way to Get Placed in Top IT Companies
Enrollment
Technology Training
Coding Practices
Realtime Projects
Realtime Projects
Placement Training
Aptitude Training
Interview Skills
Interview Skills
Panel Mock
Interview
Unlimited
Interviews
Interview
Feedback
100%
IT Career
Google Reviews

Rating
4.8
1,053 Google reviews

Surya
Special thanks to Vishal Sir, the Placement Officer, for his interview guidance, resume support, and continuous motivation throughout the placement process. I would also like…

Click here for Full Review

MATHAN KUMAR G EEE
SLA Institute provides a structured learning environment for data analytics. The syllabus is relevant, and trainers are knowledgeable. Some sessions were very useful practically, while…
Click here for Full Review

NalluKumar Ravichandran
Hi, I recently completed the DOT NET Full Stack Development course at SLA, and I had a great learning experience. The teaching style and student…
Click here for Full Review

Shaaru Menan
I had a 3 year career break. Joined SLA on Java Full Stack course and completed it.Did projects with the help of my Mentor. They…
Click here for Full Review

Nithish Sahoo
I had an excellent experience taking this DevOps course. The curriculum is well-structured and covers both fundamental and advanced DevOps concepts in a clear manner.…
Click here for Full Review

SARAN M
SLA Institute provides training in communication and aptitude along with strong technical skills. The trainers explain concepts clearly with a practical approach, which helps build…
Click here for Full Review
Discover What Our Students Have To Say
See More ReviewsPlacement Support for a Data Science Job
Genuine Placements. No Backdoor Jobs at Softlogic Systems.
Aptitude Training
from Day 1
Interview Skills
from Day 1
Softskills Training
from Day 1
Build Your Resume
Build your LinkedIn Profile
Build your GitHub
digital portfolio
Panel Mock Interview
Unlimited Interviews until you get placed
Life Long Placement Support at no cost
Unlock Career Opportunities with our Placement TrainingRequest a Free Callback
FAQs
What is Data Science?
Data Science is a field that deals with collecting data, organizing it, and looking at it to find information. This helps people make decisions. Data Science uses things like Machine Learning and Artificial Intelligence to solve problems that happen in the world.
What is the key difference between supervised and unsupervised learning?
Supervised Learning uses labeled data. It predicts outputs or results. Unsupervised Learning uses data. It identifies patterns, groups, or relationships in the data. Data Science uses both Unsupervised Learning.
What is Linear Regression?
Linear Regression is a Machine Learning algorithm. It finds the relationship between variables. This helps predict values based on existing data patterns. Data Science uses Linear Regression.
What is Logistic Regression?
Logistic Regression is a classification algorithm. It predicts categories like Yes or No, True or False. It can also predict 0 and 1 based on input data. Logistic Regression helps make classification predictions.
What is the Bias-Variance Trade-off?
The Bias-Variance Trade-off is important. It helps balance model accuracy and performance. A good model should avoid underfitting and overfitting. This ensures predictions from the model.
What is Overfitting?
Overfitting occurs when the model learns the training data too well, including noise. It includes details or noise. This reduces performance on data. Data Science tries to avoid Overfitting.
What is a Confusion Matrix?
A Confusion Matrix is a table. It helps determine the effectiveness of a classification model. It shows incorrect predictions. Data Science uses Confusion Matrices.
What is Resampling?
Resampling improves model performance and accuracy. It tests data in various ways. Cross-validation is a method used to evaluate models in data science.
What is the Central Limit Theorem?
The Central Limit Theorem is one of the important concepts in statistics. It states that with a sample size, the data distribution approaches a normal distribution. Data Science uses this theorem.
Why is Python Used in Data Science?
Python is popular in Data Science. It has syntax and is easy to learn. It has libraries and strong community support. These make it great for data analysis and Machine Learning.
Additional Information for
the Data Science Course
Additional Information for the Data Science Course
Scopes available in the future for learning Data Science
- AI Agent and Generative AI Integration: Modern data science is going beyond just processing data. It is moving towards systems that can analyze data, adapt to changes, and solve real-world business problems. These systems use Generative AI and AI agents to achieve their goals.
- Machine Learning and MLOps: Companies need professionals. They should build, deploy, and manage Machine Learning models. This is for real-time business environments.
- Data Engineering and Cloud Computing: To handle large-scale data, skills in Big Data and cloud platforms are essential. Cloud platforms like AWS, Azure, and GCP are in demand.
- AI-Powered Data Analysis: AI tools and copilots help automate data analysis. They also help with reporting and visualization. This makes data jobs more efficient. Even beginners can do them.
- Healthcare Data Science: The healthcare industry uses data science for various purposes. These include predicting diseases, analyzing patients, conducting research, and creating smart healthcare solutions.
- Fintech and Banking Analytics: Financial organizations use data science. It helps with fraud detection, customer insights, and digital payments. They also use it for risk management.
- Internet of Things (IoT) Analytics: IoT analytics helps businesses collect data from smart devices. It also helps them analyze this data for automation and real-time monitoring.
- Cybersecurity Analytics: Data science is used to identify cyber threats. It also helps to improve security systems and detect online activities.
- Business Intelligence and Data Visualization: Companies need professionals who can create dashboards. They also need people who can create business reports using tools like Tableau and Power BI.
- E-Commerce and Customer Analytics: E-commerce platforms use data science. They use it to understand customer behavior, improve product recommendations, and increase business growth.