

Introduction
Overwhelmed with data analysis and reporting? Unable to connect a variety of data sources, or have appropriate visualizations? Many beginners find the landscape of Business Intelligence confusing. This MSBI tutorial describes Microsoft Business Intelligence-MSBI in a simplified way-the powerful toolset comprising SQL Server Integration Services or SSIS, SQL Server Analysis Services or SSAS, and SQL Server Reporting Services or SSRS. We guide you through the extract, transform, and report steps in detail.
Ready to overcome your challenges in data analysis? Go through our detailed MSBI Course Syllabus here!
Why Students or Freshers Learn MSBI?
Top Reasons Freshers Should Learn MSBI
- High Demand & Job Security: The data-driven world creates an immense demand for skilled professionals who can transform raw data into logical insights, hence making MSBI (SSIS, SSAS, SSRS) one of the highly sought-after skill sets across industries.
- Complete BI Solution: You master the full Business Intelligence lifecycle, from extracting and transforming the data—SSIS—to the Analysis of it with SSAS and professional Reporting—SSRS.
- Strong Career Growth & Salary: MSBI developers get good starting salaries and also have well-defined trajectories that lead to senior designations such as BI Architect or Data Analyst, thus offering better long-term growth prospects.
- Seamless Microsoft Ecosystem: The tools integrate organically with the widely utilized Microsoft offerings, such as SQL Server and Azure, leveraging your existing platform knowledge.
- Low-Code/No-Code ETL: SSIS has a very intuitive, graphical environment that is used to perform the extract, transform, and load operations involved in data warehousing; it is thus relatively easy for a beginner to learn and use.
Want to land your first BI job? Click here and get free MSBI Interview Questions and Answers!
Check your knowledge level with our smart Knowledge Assessment Tool
- Instant skill evaluation with accurate scoring
- Identify strengths and learning gaps easily
- Designed for students and working professionals
- Smart assessment to guide your career growth
Take Your Eligibility Report Instantly
Step-by-Step MSBI Tutorial for Beginners
MSBI stands for Microsoft Business Intelligence and is a set of powerful tools grouped together in SQL Server, enabling organizations to make better decisions. Three components form:
- SQL Server Integration Services, or SSIS: For ETL (Extraction, Transformation, and Loading) jobs.
- SQL Server Analysis Services, or SSAS: These are used to build the analytical data model, Cubes, to support fast queries.
- SQL Server Reporting Services, or SSRS: These allow designing, developing, and deploying of reports.
This MSIB tutorial for beginners will take you through the necessary installation, then cover the basics of each tool in turn.
Part 1: Setup and Installation
MSBI tools come installed both with the features of SQL Server and via a separate development environment installer.
1.1. Prerequisites for MSBI
You will need the following components:
- SQL Server Database Engine: This will host your source/destination databases – and the SSIS Catalog/SSAS databases.
- SQL Server Management Studio (SSMS): This is used to manage the database engine among other services.
- SQL Server Data Tools (SSDT) / Visual Studio: This is the development environment for the creation of projects related to SSIS, SSAS, and SSRS.
1.2. Installation Steps
- SQL Server Installation
- Developer Edition Download (it’s free to develop and test).
- Run the installer and select Custom installation.
- Choose New SQL Server stand-alone installation or add features to an existing installation.
- On the Feature Selection page, make sure you select:
- Database Engine Services (Required to be on for all)
- Integration Services – SSIS.
- Analysis Services – SSAS.
- Reporting Services – SSRS.
- Proceed with the installation, making sure to identify an instance name, and then configure the Database Engine Configuration: select Mixed Mode for simplicity or Windows Authentication.
- For the Analysis Services Configuration, select Multidimensional and Data Mining Mode or Tabular Mode (Tabular is the modern choice); click Add Current User
- For Reporting Services Configuration, select Install and Configure orInstall only and configure later.
- SSDT Install SQL Server Data Tools:
- Normally, it is installed as an extension inside of Visual Studio now.
- Download and install the latest supported version of the Community Edition of Visual Studio for free
- Launch Visual Studio and click Extensions → Manage Extensions.
- Search and install the following three extensions (you may need to restart VS after each one):
- SQL Server Integration Services Projects
- SQL Server Analysis Services Projects
- Microsoft Reporting Services Projects
Part 2: SQL Server Integration Services (SSIS) – ETL
SSIS operates by moving and transforming data from various sources such as flat files, databases, or APIs into a data warehouse or other destination.
2.1. Creating an SSIS Project
- Open Visual Studio.
- Click Create a new project.
- Search and select the Integration Services Project. Name it as MyFirstSSISProject.
2.2. The SSIS Package (The ETL Workflow)
An SSIS project contains packages, or files with a .dtsx extension. Each of these packages has two main parts:
- Control Flow: It specifies what tasks should be performed in a particular order, such as downloading a file, running SQL, and data transformation. The integration of tasks takes place through Precedence Constraints, represented by arrows that define success, failure, or completion.
- Data Flow: This is where the actual extraction, transformation, and loading of data happens on a row-by-row basis.
2.3. Basic SSIS Example: Loading a Flat File
Goal: Import a simple CSV file into a SQL Server table.
Step 1. Setup Control Flow
In the Control Flow tab, drag a Data Flow Task from the SSIS Toolbox onto the designer and name it DFT_LoadSalesData.
Step 2. Configuration of Data Flow
- Double-click the DFT_LoadSalesData task. The Data Flow tab will display.
- Define the Source (Extraction – E):
- Drag a Flat File Source from the Toolbox onto the designer.
- Double-click it to open the editor. Click New to create a new Flat File Connection Manager.
- Browse to your CSV file, such as SalesData.csv. Set the format of the file: delimiters, column headers, data types.
- Click OK.
- Define the transformation T: (Optional, but Recommended)
- Drag a Data Conversion transformation from the Toolbox. Connect the output of the Flat File Source to the input of the Data Conversion.
- Double-click Data Conversion. Choose those columns you would like to convert, for instance, make sure the text field for a price is converted to a numeric type such as DT_CY for currency.
- Give an alias to the new converted columns, such as Converted_Price.
- Define destination (Loading – L):
- Drag an OLE DB Destination from the Toolbox. Connect the output of the Data Conversion to the input of the OLE DB Destination.
- Double-click it to open the editor. Click New to create a new OLE DB Connection Manager.
- Set up a connection to your SQL Server instance and to the destination database.
- In OLE DB Destination Editor, select the destination table.
- Go ahead and click on Mappings in the menu bar to make sure the source columns match up correctly with the destination table columns.
- Click OK.
2.4. Running and Deployment
- Run: F5, or click Start in the Visual Studio toolbar. You can watch the Control Flow and Data Flow tasks change color to show they completed successfully, in green, or failed, in red.
- Deployment: To deploy to production, the project is usually deployed to the SSIS Catalog (SSISDB) on the SQL Server instance, which lets you manage the execution and schedule packages using SQL Server Agent.
Part 3: SQL Server Analysis Services (SSAS) – Data Analysis
SSAS is used to create analytical models for reporting and deep analysis. We will focus on the modern Tabular Mode, utilizing in-memory processing.
3.1. Create an SSAS Tabular Project
- Open Visual Studio.
- Choose Create a new project.
- Search and select Analysis Services Tabular Project.
- Name it as SalesAnalysisModel, or any other name you want to give.
3.2. Design the Data Model
- Import Data:
- In Visual Studio Model and go to Model → Import from Data Source.
- Choose a relational database; for example, your Sales Data Warehouse by using a SQL Server connection.
- Choose the dimension tables (DimCustomer, DimDate) and the fact tables (FactSales) that comprise your star or snowflake schema.
- Define Relationships:
- Switch to Diagram View in the designer.
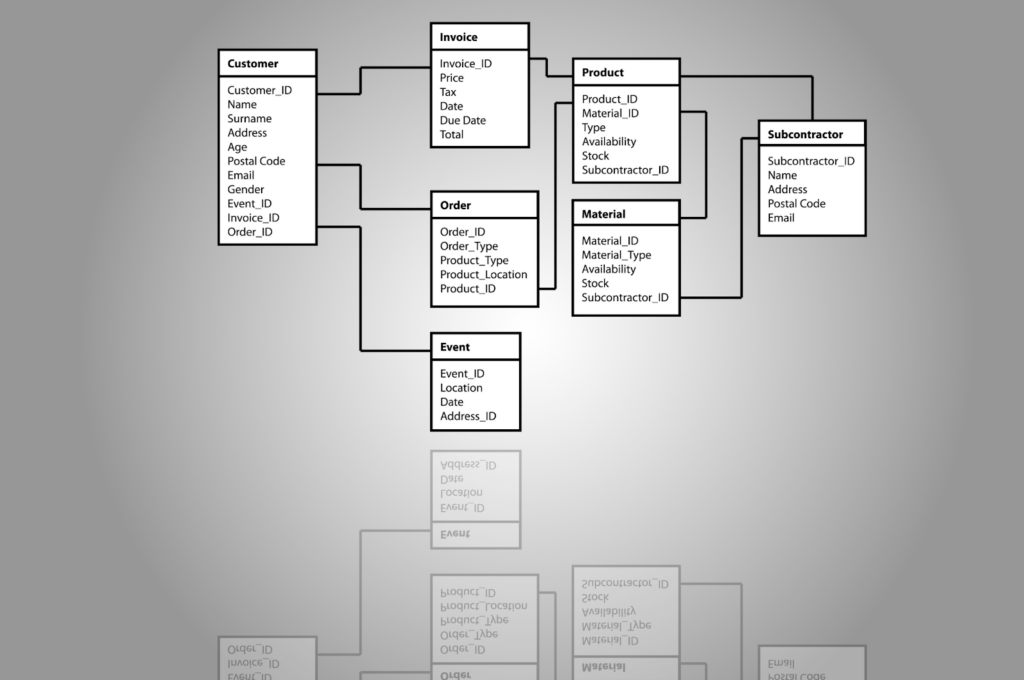
Define relationships (joins) between your fact and dimension tables (e.g., `FactSales.CustomerID` linked to `DimCustomer.CustomerID`). This is crucial for slicing and dicing the data.
- Create Measures (DAX):
- Measures are the calculations used for the analysis, such as total sales, profit margin. You write them by using the DAX – Data Analysis Expressions – language.
- In your fact table – for instance, FactSales – click in the measure grid below the data.
- Example Measure (Total Sales):
Total Sales := SUM(‘FactSales'[SalesAmount])
- Example Measure (Total Quantity):
Total Quantity := SUM(‘FactSales'[Quantity])
- Deploy the Model:
- In the Solution Explorer, right-click the project name and choose Properties.
- Set the Deployment Server property to the name of your SQL Server Analysis Services instance.
- Right-click the project and select Deploy. This will publish your Tabular model (Cube) to the SSAS server and it will be queryable.
Part 4: SQL Server Reporting Services (SSRS) – Reporting
SSRS is responsible for creating and deploying paginated and interactive reports, consuming data provided by SQL queries or SSAS Cubes.
4.1. Create an SSRS Project
- Open Visual Studio.
- Click on Create a new project.
- Search for and select Report Server Project. Give it a name such as SalesReports.
4.2. Generate a Simple Tabular Report
- In the Solution Explorer, right-click on Reports → Add → New Item… → Report. Name it DailySales.
- Create a Data Source:
- Right-click in the Report Data pane and select Data Sources → Add Data Source…
- Name it DS_AdventureWorks.
- Click Embedded connection, then select the connection type (e.g., Microsoft SQL Server).
- Click Edit and fill in the SQL Server Connection Details.
- Create Dataset: (Data Extraction)
- Right-click the Datasets in the Report Data pane → Add Dataset.
- Name it SalesByDate.
- Select Use a dataset embedded in my report and select your DS_AdventureWorks Data Source.
- Enter a basic SQL query below (or MDX/DAX if using an SSAS Cube):
SELECT
CAST(OrderDate AS DATE) AS SaleDate,
SUM(SalesAmount) AS TotalSales,
COUNT(DISTINCT CustomerID) AS TotalCustomers
FROM
FactSales
GROUP BY
CAST(OrderDate AS DATE)
ORDER BY
SaleDate;
- Design the Report:
- Drag a Table from the Toolbox onto the report body.
- Drag the fields from the SalesByDate Dataset in the Report Data pane onto the table columns, for example SaleDate, TotalSales, TotalCustomers.
- Use the format option to enhance the presentation of the data – for instance, the format for the TotalSales as currency.
- Preview and Deploy:
- Click the Preview tab to test your report.
- To deploy, right-click the project in the Solution Explorer, select Properties, and set the Target Report Server URL (e.g., http://localhost/ReportServer).
- Right-click the project and select Deploy. The report will be published to the SSRS Web Portal and ready for end-users.
MSBI is a vast field, and mastering these components would take you on a strong path to a career in Data Warehousing and Business Intelligence. Ready to try out your practical knowledge? Enroll in our MSBI Online Training to practice real-world scenarios!
Real Time Examples for MSBI Tutorial for Learners
Here are some realistic, real-time scenarios that show how organizations use the MSBI stack-SSIS, SSAS, SSRS-to solve business problems:
Retail Sales Forecasting and Inventory Management
- SSIS Role-ETL: An SSIS package runs every night to extract sales transaction data from various POS systems, customer information from the CRM, and inventory levels from the ERP system.
- It transforms the data-preparing product names to a standard format and aggregates daily sales, among other things-and then loads it into a central Data Warehouse.
- SSAS Role-Analysis: In SSAS, create a Tabular or Multidimensional model. This allows analysts to slice sales data quickly for store, product category, date range, and promotion type.
- They will use DAX measures to calculate metrics like “Year-over-Year Sales Growth” and “Inventory Turnover Rate.”
* **SSRS Role (Reporting):** SSRS reports deliver key findings:
* An operational report shows low-stock alerts for managers.
* A dashboard summarizes regional performance for executives.
Banking – Fraud Detection and Compliance Reporting
- SSIS Role-ETL: SSIS ingests high-volume financial transaction logs from various disparate banking systems into a staging area.
- With the help of complex transformations like fuzzy lookups and scripting components, it identifies and flags suspicious patterns before loading the data into a security database.
- SSAS Role: The SSAS cube offers access to aggregated transaction volumes, customer profiles, and flagged activity at real-time high speed.
- Analysts query the model to identify emerging fraud trends or to confirm the rules for the existing detection of fraud.
- SSRS Role: Reporting SSRS is put into use for regulatory compliance. Generating every month static, pixel-perfect reports regarding AML checks and SARs to be submitted to government bodies.
Healthcare Patient Readmission Reduction
- SSIS Role (ETL): SSIS extracts patient demographic data, clinical records, and billing information from disparate Electronic Health Record systems.
- The cleaned data is then loaded into a central data mart focused on patient outcomes.
- SSAS Role-Analysis: The SSAS model includes dimensions like Hospital, Physician, and Diagnosis.
- Measures are calculated on the SSAS model like “30-Day Readmission Rate” and “Average Length of Stay” that helps the management in identifying the high-risk patient groups and ineffective discharge protocols.
- SSRS Role: Reporting Physicians are provided with drill-down SSRS reports that compare their own patient readmission rates with those of the overall hospital average to provide focused quality improvement efforts.
Ready to practice what you just learned? Check out some of our MSBI Project Ideas and get started on building your portfolio!
FAQs About MSBI Tutorial for Beginners
1. What is MSBI used for?
MSBI is a suite of tools from Microsoft used to convert raw unorganized data into meaningful business insights. Its main function is that it provides for ETL, or the Extract, Transform, and Load process, organization of multi-dimensional data, and reporting that enable an organization to make decisions based on facts.
2. What is the full form of MSBI in SSIS?
MSBI stands for Microsoft Business Intelligence. SSIS is one of the three core components that make up the MSBI stack and stands for SQL Server Integration Services. It is the primary tool used in developing the ETL processes that move data into a data warehouse for analysis.
3. What does a MSBI developer do?
MSBI Developer designs, develops, and maintains the BI solutions based on MSBI tools SSIS, SSAS, SSRS by creating ETL pipelines and designing data warehouses using dimensional modeling. This involves creating OLAP cubes for analysis, and making reports interactive.
4. Which tool is used for SSIS?
The SQL Server Data Tools (SSDT) within the Microsoft Visual Studio is an extension that serves as the development environment for SSIS. It provides a graphical interface called SSIS Designer for dragging, dropping, and configuring various tasks, data flow components of an ETL package.
5. What is the salary of MSBI developer in India?
The average MSBI salary for an Experienced developer in India is about ₹16.4 lakhs per year. Salaries typically start from around ₹15.1 lakhs and go up to ₹24.5 lakhs based on factors such as years of experience, expertise on a particular skill such as cloud integration, and company location.
6. Is MSBI in demand?
Yes, MSBI skills are still in demand, especially for enterprise data warehousing and on-premises solutions. While cloud tools like Azure Data Factory and Power BI are growing, organizations with existing SQL Server infrastructure require developers to maintain and modernize their foundational SSIS and SSAS solutions.
7. Does SSIS need coding?
While SSIS is primarily a graphical interface using drag-and-drop components, the design of ETL solutions involves very little coding. If there are complex or custom logics, then either the Script Task or the Script Component allows writing code in C# or VB.NET, respectively.
8. Is SSIS still relevant in 2026?
Yes, SSIS is still relevant. Microsoft continues to update the product, and the release of SSIS 2025 aligns with SQL Server 2025. It is also supported with “lift-and-shift” migration to Microsoft Fabric Data Factory and remains critical for both hybrid and on-premises data integration needs.
9. What are MSBI tools?
Core MSBI tools are: SQL Server Integration Services-SSIS is for data integration/ETL; SQL Server Analysis Services-SSAS is for creating analytical data models (cubes); and SQL Server Reporting Services-SSRS is for designing and deploying paginated reports.
10. What language is used in SSIS?
The .NET languages, either C# or Visual Basic .NET, are the major languages used in SSIS for advanced scripting through its Script Task or Script Component. Besides that, the Execute SQL Task mostly contains T-SQL, which is used by a developer for database operations.
Conclusion
You’ve grasped the big powers of MSBI: mastering ETL with SSIS, enabling fast analytics with SSAS, and generating vital reports with SSRS. It is an integrated toolset that forms the bedrock for modern data-driven decision-making. With MSBI learning, you are building one of the most valuable and future-proof career skills. Don’t stop here; all the real expertise will come with structured practice. Turn into a certified BI professional with our MSBI course in Chennai that includes all the details.