
Power BI Desktop: Learn to Visualize Data Like Never Before
Nowadays, very few people are inexperienced with the idea of business intelligence. The majority of companies have previously implemented or had plans to implement business intelligence to address their issue, as more solutions are constantly being developed to assist in resolving the data management crisis. Microsoft’s newest BI tool, Power BI, is primarily designed to assist everyone in analyzing and visualizing their data.
Deep dive into data visualization methods through our Power BI Training in Chennai with IBM Certification
What is Data Visualization?
To add value to data, big data is utilized for predictive analytics, user behavior analysis, and other data analytics operations. Nevertheless, because of ignorance, the basic facts around this may remain ambiguous. Data visualization aids in resolving this problem. Data visualization is the act of converting data into diagrams, pictures, graphs, and even movies that help us understand the figures and provide new perspectives.
What is BI?
Business intelligence (BI) is a collection of methods and instruments for turning unprocessed data into knowledge that can be used for business analysis. Simply explained, business intelligence is the technology that allows the appropriate individuals to receive the appropriate data at the appropriate moment in order to facilitate more efficient company choices.
What is Power BI?
With the help of Microsoft Power BI, you can easily connect your data, prepare it, and model it however you like. You may use it to extract business intelligence for better decision-making by transforming all of your data into live interactive visualizations and customizing real-time business view dashboards.
Using this tool, you can link to hundreds of data sources, including Excel, Google Analytics, IoT devices for real-time data, and more. You can even incorporate your own custom visualizations into your app or website.
What is Power BI Desktop?
You can ingest, transform, integrate, and augment your data using Power BI Desktop. All of your data sources are connected via Power BI Desktop, which also makes data evaluation and sharing simpler with scalable dashboards, interactive reports, embedded visualizations, and other features.
The most frequent uses for Power BI Desktop include connecting to data, transforming and cleaning that data, creating a data model, creating visuals that give the data a visual representation, such as charts and graphs, creating reports that are collections of visuals on one or more report pages, and sharing reports with others via the Power BI service.
Installation and configuration of Power BI Desktop
Here are a few methods for installing Power BI:
- Open the Microsoft Store, type in “Power BI,” and then select “Get” to download it.
- Visit the Power BI Desktop download page and select the option to “Download for free.”
- By logging in and selecting the download icon in the top right corner of the page, you may also get Power BI Desktop for free from the Power BI service website.
You can now browse the Power BI service website and log in to your account after installing Power BI Desktop. If you haven’t done so already, scroll down to sign up for free using your work or school email account.
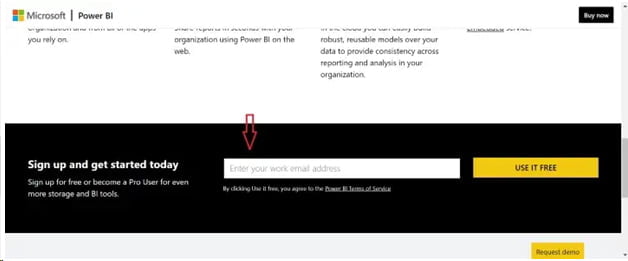
As an alternative, you can register for a Microsoft trial account by clicking here if you do not have a student or work email address.
Let’s run Power BI Desktop after it has been installed and then study its key features.
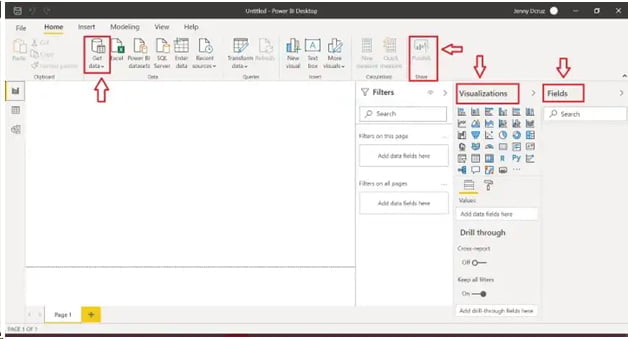
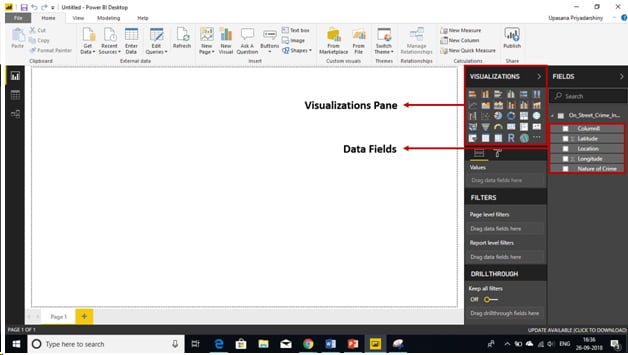
Fields: You may view the fields of the imported data here.
Visualizations: The various graphics that you can use to present unique visualizations of your data are contained in this pane.
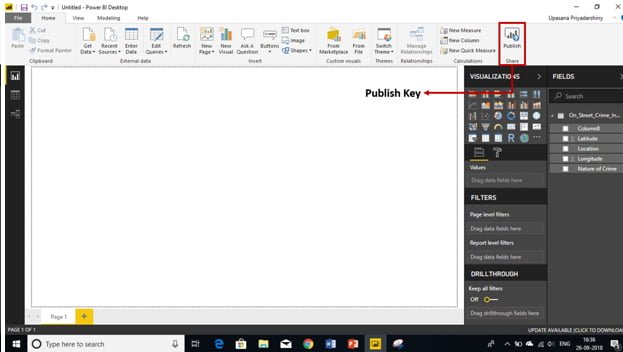
Publish: You can publish your data model to your Power BI workspace using the publish option.
Get Data: enables you to import data in several formats, including xml, text/csv, and excel files. We can also get information from Google Analytics, GitHub, Microsoft Azure, and other web services.
Prepare reports like a pro through our Data Visualization Courses in Chennai with IBM Certification at Softlogic Systems.
Data Preparation in Power BI Desktop
You can import data of varying sizes from many platforms using the “Get data” option. All the materials required for this tutorial are available for download right here.
Click Transform Data after opening the “SalesData.xlsx” excel file and choosing the In-Stock Data sheet from the window’s left side. You should now be in the Power Query Editor as a result. You can browse and edit the data using the Power Query Editor.
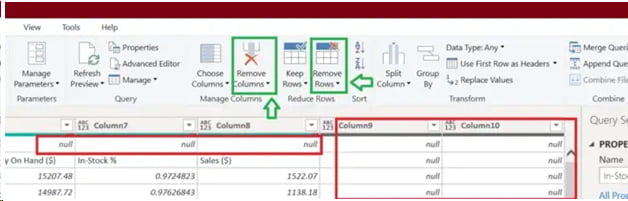
The first thing we notice while viewing the In-Stock data file is that the first row, as well as Columns 9 and 10, have null values. Let’s clear that up since values like this hinder the overall performance of our model. By choosing “Remove Rows” and “Remove Columns,” respectively, you can eliminate the rows and columns.
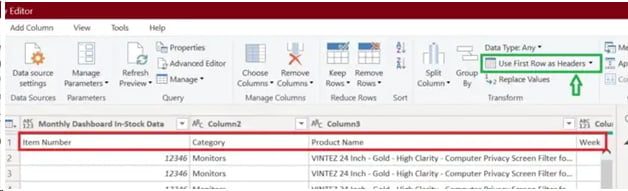
Once we’ve done so, we might now realize that our column name actually makes up the first row of our data. Let’s alter it by choosing “Use the first row as headers” instead.
To confirm that our modifications have taken effect, click “Close & Apply” in the Power Query Editor’s upper-left corner of the home section.
By selecting the data view icon on the left of the window, you may even quickly alter the data type of a column.
It can take a lot of time and effort to clean up our data. There are many more methods than those mentioned above for handling data that have a few evident anomalies.
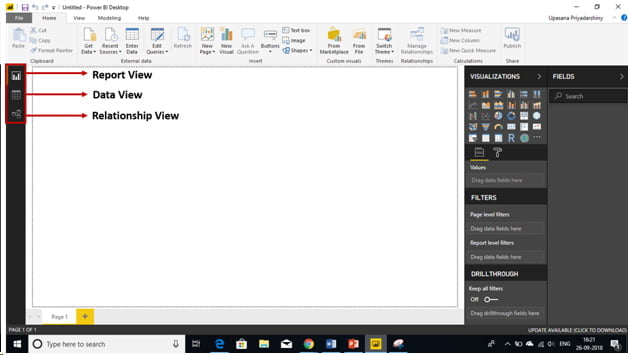
Power BI Desktop’s Core Views
Consequently, a blank screen appears when you initially load your data. You can see these three standard perspectives on the left.
Input View: You’ll build the dashboard here.
View Data: You can get a preview of your data here and make changes as needed. A new computed column can be made here as well.
View of Relationships: The relationship between the objects is shown here.
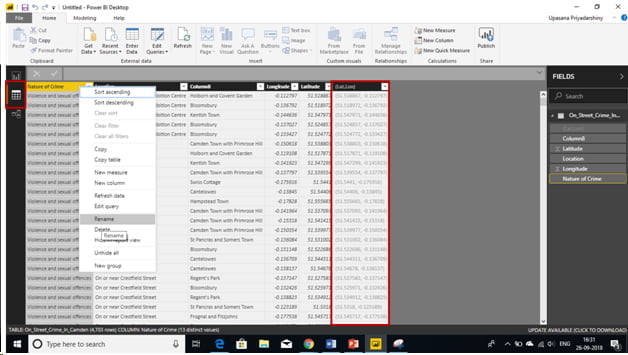
Data View
The data view should always be used first. You essentially receive a preview of your data’s appearance. Before you begin building the dashboard, there are a few things to take care of.
Rename Column: We’re constructing the dashboard for the user. We want it to be as interactive as possible, therefore all the naming conventions and data types will be visible at the surface.
Remove Columns: Remove anything from the model that is not absolutely necessary. since processing it will consume more system resources and increase the size of the model.
Hide Columns: Columns that you will subsequently need for calculations but that the user doesn’t necessarily need to see should be hidden. The concealed column will be highlighted in gray and excluded from the report view.
Generating Report
We shall now make a chart. We first choose the data fields, then drag & drop them into the designated area.
The final result ought to resemble the following.
Publish Report
And at this point, we’re prepared to upload this to the Power BI website. Simply click the “Publish” button in the right upper corner of the screen to finish.
Conclusion
You have now gained knowledge about data visualization with Power BI Desktop. When creating data visualizations, three things must be kept in mind: keep it simple, highlight crucial facts, and narrow your target audience. Learn more in our Power BI Training Center with real-world experience at Softlogic Systems in Chennai.