
Starting with DAX in Power BI
This article intends to give a quick overview of the mathematical language known as Data Analysis Expressions (DAX) to those who are unfamiliar with the Power BI Desktop. If you are familiar with SQL or MS Excel functions, many of the calculations in this article on the fundamentals of Power BI DAX will look familiar to you.
Basics of Power BI DAX : What is DAX?
With the help of the Power BI Desktop, reports can be easily made that provide insightful data right away. But what if you need to analyze the growth % for each of the several date ranges and all the product categories? Or do you need to compare your company’s annual growth rate to those of industry leaders?
Gaining proficiency with DAX will enable you to make the most of your charts and visualizations and address practical business issues.
With the help of data already available in your model, DAX’s functions, operators, and constants can be combined to create formulas that can be used to calculate values.
A collection of more than 200 functions, operators, and structures is available in the Power BI DAX. Due to the enormous versatility of its library, it can create measures to calculate outcomes for almost any data analysis requirement.
Basics of Power BI DAX : How does it operate?
Three key ideas—Syntax, Context, and Functions will serve as the foundation for how we frame our understanding of Power BI DAX.
There are additional significant ideas in this context, but mastering these three will give you the strongest groundwork for developing your skills.
Syntax
A formula’s syntax is made up of different elements that determine how it is written. View this straightforward DAX formula. It is frequently helpful to break down each component into a language you think and speak on a daily basis while attempting to grasp a DAX calculation. Consequently, this formula has the following syntactic components:
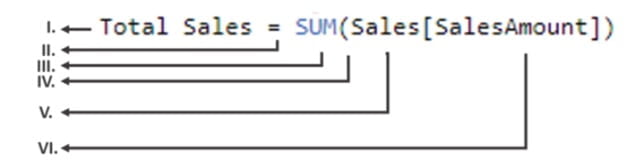
- Total Sales is the name of the metric.
- The equals sign operator (=) denotes the start of the equation.
- SUM adds together each and every value in the Sales[SalesAmount] column.
- The expressions with this parenthesis () around them contain one or more arguments. Every function needs one argument at the very least.
- The table is referred to as Sales.
- A value is passed to a function by an argument. The SUM function understands the column on which it must aggregate and SUM from the referenced column [SalesAmount], which is an input.
Simply written, it says to “calculate (=) the SUM of values in the [SalesAmount] column in the Sales table for the measure labeled Total Sales.”
A recommendation tool in the Power BI DAX editor helps in the creation of syntactically sound formulas by recommending the appropriate components.
Context
One of the three DAX principles, context, is among the most crucial. When discussing context, one of the two categories—Row context or Filter context—may be meant. The Row-Context is most commonly used when referring to Measures and is most readily understood as the current row. It is applicable whenever a formula’s function applies filters to isolate a certain table row.
The Row-Context is simpler to comprehend than the Filter-Context. The Filter-Context is best understood as a set of filters used in a calculation. Instead of the Row-Context, there is a Filter-Context. It applies instead in addition to the first. Take a look at the DAX formula below.
The following syntax elements are present in this formula:
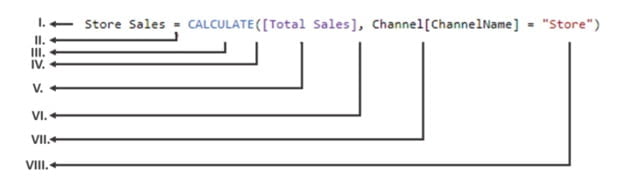
- The Store Sales is the measure name.
- The formula’s starting point is indicated by the equals sign (=).
- The CALCULATE function, when given an expression as an input, evaluates it.
- An expression with one or more arguments is enclosed in parenthesis ().
- Total Sales as a metric within the same table as the expression.
- The first expression argument and the filter argument are separated by a comma (,).
- Our Row-Context is the fully qualified referenced column Channel[ChannelName]. This column’s rows each identify a channel, such as a store, online, etc.
- A filter is applied using the specific value, Store. Our filter context is as follows.
By using “Store” as a filter, this formula makes sure that the Total Sales Measure is only generated for rows in the Channel[ChannelName] Column.
Functions
Formulas for functions are predefined, organized, and structured. They use the arguments that are supplied to them to perform calculations. These arguments could be functions, text, numbers, or logical values.
Calculated Columns & Measures in Power BI DAX
We’ll be concentrating on the Power BI DAX formulas used in Measures and Calculated Columns in this article.
Calculated Columns
On the Power BI Desktop, you can expand a table by adding extra columns while developing a data model. A DAX expression that is applied to the table’s rows individually or in the context of the current row determines the columns’ contents. However, in data models for DAX, all calculated columns take up memory and are calculated during table processing.
Although this behavior aids in improving user experience, it wastes valuable RAM and is therefore a terrible habit in production since each intermediate calculation is saved in RAM and takes up valuable space.
Measures
There is an additional method for specifying computations in DAX models, which is helpful if you need to work with aggregate values rather than individual rows. These figures represent measurements. A measure must be defined in a table; this is one requirement of DAX. But the measurement doesn’t actually belong on the table. As a result, you can transfer a measure between tables without having it lose its functionality.
Measures vs Calculated Columns
DAX expressions are used in both measures and calculated columns. The context of the judgment makes a difference. A calculated column is computed at the row level within the table it belongs to, whereas a measure is evaluated in the context of the cell evaluated in a report or in a DAX query.
Measures and calculated columns differ greatly despite having similar looks. The value of a calculated column is determined during a data refresh and depends only on the context provided by the current row in the report.
Thus, whenever you want to do the following, you must define a calculated column.
- Put the calculated results in a slicer, view them in rows or columns (rather than the values area) in a pivot table, on the axes of a chart, or as a filter condition in a DAX query.
- Create a definition for an expression that is firmly tied to the current row. For instance, Price * Quantity is incompatible with the average or sum of the two columns.
- Sort text or numbers by category. For instance, a measurement’s possible range of values.
Depending on the filter used in the report, such as the slicer, rows, and columns selection in a pivot table, or the axes and filters used in a chart, a measure operates on aggregates of data that are specified by the current context.
Therefore, whenever you want to display calculation results that incorporate user choices, you must create a measure, such as;
- When you compute the profit margin using a particular set of data.
- When calculating ratios between a product and all other products, keep the region and year filters active.
Basics of Power BI DAX: DAX Function Types
1. Aggregate Functions
MIN
The least numeric value in a column or between two scalar expressions is returned by this DAX function.
Syntax
MIN(<column>)
Example
=MIN([ResellerMargin])
MINA
The minimal value in a column, including any logical values and text-based integers, is returned by this DAX function.
Syntax
MINA(<column>)
Example
=MINA(([PostalCode])
MINX
The least numerical value that results from evaluating an expression for each row of a table is returned by this DAX function.
Syntax
MINX(<table>, < expression evaluated for each row>)
Example
=MINX( FILTER(InternetSales, InternetSales[SalesTerritoryKey] = 5), InternetSales[Freight] + InternetSales[TaxAmt])
MAX
The maximum value in a column, including any logical values and text-based integers, is returned by this DAX function.
Syntax
MAX(<column>)
Example
=MAX([ResellerMargin])
MAXA
The maximum value in a column, including any logical values and text-based integers, is returned by this DAX function.
Syntax
MAXA(<column>)
Example
=MAXA(([PostalCode])
MAXX
The largest numeric value that may be obtained by evaluating an expression for each row in a table is returned by this DAX function.
Syntax
MAXX(<table>, < expression evaluated for each row>)
Example
=MAXX( FILTER(InternetSales, InternetSales[SalesTerritoryKey] = 5), InternetSales[Freight] + InternetSales[TaxAmt])
SUM
All of the numbers in a column are added by this DAX function.
Syntax
SUM(<column>)
Example
=SUM(Sales[Amt])
AVERAGE
The arithmetic mean of the numbers in a column is returned by this DAX function.
Syntax
AVERAGE(<column>)
Example
=AVERAGE(InternetSales[ExtendedSalesAmount])
SUMX
This DAX method gives an expression’s sum after it has been tested for each row in a table.
Syntax
SUMX(<table>, <expression evaluated for each row>)
Example
=SUMX(FILTER(InternetSales, InternetSales[SalesTerritoryID]=5),[Freight])
AVERAGEX
The arithmetic mean of a group of expressions evaluated across a table is determined by this DAX function.
Syntax
AVERAGEX(<table>, <expression evaluated for each row>)
Example
=AVERAGEX(InternetSales, InternetSales[Freight]+ InternetSales[TaxAmt])
2. Count Functions
DISTINCTCOUNT
This DAX method returns the number of unique elements in a column. As a result, if an item has several numbers, this method will count them as one item.
Syntax
DISTINCTCOUNT(<column>)
Example
=DISTINCTCOUNT(ResellerSales USD[SalesOrderNumber])
COUNT
This DAX method returns the number of items in a given column. As a result, if an item has numerous numbers, this function will count them as individual things rather than as a single item.
Syntax
COUNT(<column>)
Example
=COUNT([ShipDate])
COUNTA
This DAX method returns the number of items in a column that are present but not empty.
Syntax
COUNTA(<column>)
Example
=COUNTA(‘Reseller'[Phone])
COUNTROWS
A DAX function called countRows counts the number of rows in the given table or a table specified by an expression.
Syntax
COUNTROWS(<table>)
Example
=COUNTROWS(‘Orders’)
COUNTBLANK
This DAX function keeps track of how many cells in a column are empty.
Syntax
COUNTBLANK(<column>)
Example
=COUNTBLANK(Reseller[BankName])
3. Date-Time Functions
DATE
The supplied date is returned using the Date-Time format by this DAX function.
Syntax
DATE(<year>, <month>, <day>)
Example
=DATE(2019,12,17)
HOUR
The provided hour is returned by this DAX function as a number between 0 and 23. (12:00 A.M. to 11:00 P.M.).
Syntax
HOUR(<datetime>)
Example
=HOUR(‘Orders'[TransactionTime])
TODAY
The current date is returned by this DAX function.
Syntax
TODAY()
NOW
The current date and time are returned using the Date-Time format by this DAX function.
Syntax
NOW()
EOMONTH
The date of the last day of the month, before or after a specified number of months, is returned by this DAX method in Date-Time format.
Syntax
EOMONTH(<start_date>, <months>)
Example
=EOMONTH(“March 3, 2008”,1.5)
4. Mathematical Functions
ABS
The absolute value of the supplied number is returned by this DAX function.
Syntax
ABS(<number>)
Example
=ABS([DealerPrice]-[ListPrice])
EXP
The result of this DAX function is e raised to the power of the inputted number.
Syntax
EXP(<number>)
Example
=EXP([Power])
FACT
The factorial of a number is returned by this DAX function.
Syntax
FACT(<number>)
Example
=FACT([Values])
LN
The natural log of the inputted number is returned by this DAX function.
Syntax
LN(<number>)
Example
=LN([Values])
LOG
This DAX function provides the log with the specified number’s base.
Syntax
LOG(<number>,<base>)
Example
The results of the following are all the same, 2.
=LOG(100,10)
=LOG(100)
=LOG10(100)
PI
The result of this DAX function is the value of Pi.
Syntax
PI()
POWER
The value of the first parameter raised by the power of the second argument is the result of this DAX function.
Syntax
POWER(<number>, <power>)
Example
=POWER(5,2)
QUOTIENT
This DAX function divides the result and returns the quotient’s integer component.
Syntax
QUOTIENT(<dividend>, <divisor>)
Example
=QUOTIENT(5,2)
SIGN
The sign of a given number is returned by this DAX function.
Syntax
SIGN(<number>)
Example
=SIGN( ([Sale Price] – [Cost Price]) )
SQRT
The square root of the inputted number is returned by this DAX function.
Syntax
SQRT(<number>)
Example
=SQRT(25)
6. Logical Functions
AND
With two expressions, this DAX function produces a logical AND (conjunction). Both of the mentioned requirements must be true for AND to return true.
Syntax
AND(<logical argument1>,<logical argument2>)
Example
=IF(AND(10 > 9, -10 < -1), “All true”, “One or more false”
The AND function returns “All True” because the two conditions that are used as parameters are both true.
OR
With two expressions, this DAX function executes a logical OR(disjunction). Either of the two stated conditions must be true for OR to return true.
Syntax
OR(<logical argument1>,<logical argument2>)
Example
=IF(OR(10 > 9, -10 >-1), “True”, “False”
The OR function returns “True” because one of the conditions that are supplied as arguments is true.
NOT
This DAX function performs the given expression according to logic.
Syntax
NOT(<logical argument>)
Example
=NOT([CalculatedColumn1])
The NOT method delivers the logical opposite of the specified value for each row in Calculated Column1.
IF
This DAX function examines a number of inputs to determine which one meets the criteria stated in the argument.
Syntax
IF(logical_test>,<value_if_true>, value_if_false)
Example
=IF([Calls]<200,”low”,IF([Calls]<300,”medium”,”high”))
IFERROR
This DAX function tests an expression and, in the event of an error, returns a predetermined value.
Syntax
IFERROR(value, value_if_error)
Example
=IFERROR(25/0,9999)
7. Information Functions
ISBLANK
After determining whether a value is blank, this DAX method returns TRUE or FALSE.
Syntax
ISBLANK()
Example
=IF( ISBLANK(‘CalculatedMeasures'[PreviousYearTotalSales]) , BLANK() , ( ‘CalculatedMeasures'[Total Sales]-‘CalculatedMeasures'[PreviousYearTotalSales] ) /’CalculatedMeasures'[PreviousYearTotalSales])
ISNUMBER
After determining whether a value is a numeric value, this DAX method returns TRUE or FALSE.
Syntax
ISNUMBER()
Example
=IF(ISNUMBER(0), “Is number”, “Is Not number”)
ISTEXT
After determining whether a value is a text, this DAX method returns TRUE or FALSE.
Syntax
ISTEXT()
Example
=IF(ISTEXT(“text”), “Is Text”, “Is Non-Text”)
ISNONTEXT
This DAX function determines whether a value is non-text and then returns TRUE or FALSE.
Syntax
ISNONTEXT()
Example
=IF(ISNONTEXT(“text”), “Is Non-Text”, “Is Text”)
ISERROR
This DAX function determines whether a value is incorrect before returning TRUE or FALSE.
Syntax
ISERROE()
Example
=IF( ISERROR( SUM(‘ResellerSales_USD'[SalesAmount_USD]) /SUM(‘InternetSales_USD'[SalesAmount_USD]) ) , BLANK() , SUM(‘ResellerSales_USD'[SalesAmount_USD]) /SUM(‘InternetSales_USD'[SalesAmount_USD]) )
8. Text Functions
CONCATENATE
By combining two text strings into one, this DAX function.
Syntax
CONCATENATE(<text1>, <text2>)
Example
=CONCATENATE(“Hello “, “World”)
CONCATENATEX
An expression was evaluated for each row in a table to produce the output of this DAX function.
Syntax
CONCATENATEX(<table>, <expression>, [delimiter])
Example
=CONCATENATEX(Employees, [FirstName] & “ “ & [LastName], “,”)
FIXED
This DAX function returns the result as text after rounding a number to the provided number of decimals.
Syntax
FIXED(<number>, <decimals>, <no_commas>)
Example
=FIXED([PctCost],3,1)
REPLACE
Based on the amount of characters you give, this DAX function substitutes a portion of a text string with a different text string.
Syntax
REPLACE(<old_text>, <start_num>, <num_chars>, <new_text>)
Example
=REPLACE(‘New Products'[Product Code],1,2,”OB”)
SEARCH
This DAX function provides the character count at which a particular text string is first seen.
Syntax
SEARCH(<find_text>, <within_text>
[, [<start_num>]
[, <NotFoundValue>]])
Example
=SEARCH(“n”,”printer”)
Since “n” is the fourth character in the word “printer,” the calculation returns 4.
UPPER
The output of this DAX function is an uppercase text string.
Syntax
UPPER (<text>)
Example
=UPPER([‘New Products'[Product CoDepending on the filtersde])
Basics of Power BI DAX : Making Your First Measure
Prerequisite : You must launch the provided Power BI Desktop file.
We’ll be describing this bit in great detail so you can follow along since I’m presuming this will be your first.
- Right-click the Sales table in the field list of the Report View, then select the New Measure.
- Replace Measure in the Formula Bar by entering the name of the new measure, Previous Quarter Sales.
- You should employ the CALCULATE function in this formula. So, type the first few letters of CAL after the equals sign, and then double-click the desired function.
- There are at least two arguments for the CALCULATE function. The expression that has to be evaluated comes first, followed by a filter.
- Type SUM followed by another opening parenthesis (to send an argument to the SUM function after typing CALCULATE for the CALCULATE function.
- Start by typing Sal, then choose Sales[SalesAmount], and then add a closing parenthesis. This is our CALCULATE function’s first expression argument.
- To specify the first filter, type a comma (,), a space, and then PREVIOUSQUARTER. We’ll use this as our filter.
- To filter SUM findings by the previous quarter, utilize the PREVIOUSQUARTER time intelligence function.
- Type Calendar[DateKey] after the opening parentheses (for the PREVIOUSQUARTER function.
- One column providing a continuous range of dates serves as the only argument for the PREVIOUSQUARTER function. That is the DateKey column in the Calendar database in our example.
- Type two closing parenthesis to indicate that the arguments being supplied to the CALCULATE and PREVIOUSQUARTER functions are both closed.
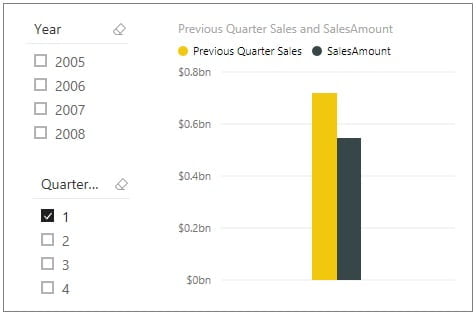
- Your formula should now resemble the following: Previous Quarter Sales = CALCULATE(SUM(Sales[SalesAmount]), PREVIOUSQUARTER(Calendar[DateKey]))
- To validate the formula, press Enter or click the check mark in the formula bar.
Once you’ve done so, you’ve just added a measure using DAX to your model—and it wasn’t a simple one at that.
Depending on the filters used in a report, this formula determines the total sales for the prior quarter.
Conclusion
You can start making DAX formulas for measurements on your own once you have a basic understanding of the Power BI DAX concepts. Although DAX has been around for a while and there are many resources online, learning it can be a little challenging at times. You can discover business solutions with Power BI DAX after reading this blog. For the best practices, join Power BI Training in Chennai at Softlogic Systems.