
Beginner’s Guide on How to Create and Utilize Parameters in Tableau
When creating dashboard reports in Tableau, you can use parameters to leverage aggregated values that aren’t included in your data. After creation, end users can alter the input to see how the parameter has affected the outcome. One of the hot trends in business intelligence for this year is Tableau. There appears to be no better time than “now” to become certified in Tableau, based on Google Trends.
What are the Parameters in Tableau?
A parameter is any value that is supplied to a program to alter it for a certain function. Anything could be it: Several examples are a text string, a set of values, or a dollar amount.
Using parameters, you can experiment with different what-if scenarios. Consider being uncertain about which fields to include in your view or which layout will be most appealing to your target audience. You can add parameters to your view, charts, and graphs to give users the choice of how to show the data.
When using parameters, you must connect them in some way to the view:
- The view’s use of calculations and calculated fields.
- To make the parameter control visible in the view so that people can choose their settings.
- To use parameter references in parameter actions.
Steps to Create and Use Parameters in Tableau
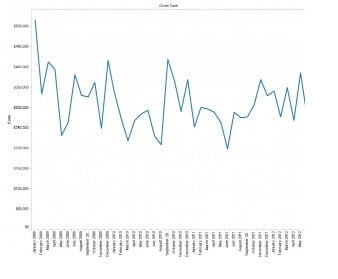
Step 1: Open Tableau and connect to the Superstore Sample DataSet to get started.
- Put Order Date to the Columns Shelf and Sales to the Rows Shelf.
- Right-click the year pill on the shelf in the column.
- Select More>Custom.
- Select the Month/Year option from the dropdown menu when the Custom Date dialogue box appears.
Your graph should look as follows:
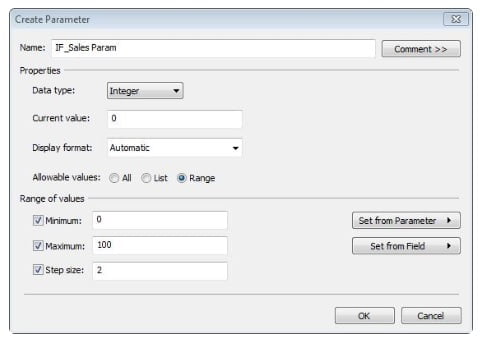
Step 2: Create Parameters in Tableau
For Example, What if Sales increased by 3%?
Make a parameter by performing the following;
- Select Create Calculated Field from the Analysis Menu. As an alternative, you might right-click anywhere in the Measures pane and choose Create Calculated Field.
- We must now create the parameter before we can create the calculated field that will use it. There is a section labeled Parameter and a link labeled Create next to it on the window’s lower half. Select Create.
- As shown, complete the fields exactly.
- Select OK. Your parameter is now shown in the box for parameters.
Step 3: Using Tableau Parameters in Calculations
In this situation, we now want to create a calculated field to add to our graph in order to understand how it affects our data by using our parameters and a few Tableau functions. Create your calculated field while you are still in the Calculated Field dialogue window:
- Give your calculated field the name IF Sales (Calc)
- Formula: (([IF Sales Param]/100)+1) [Sales]
- Select OK.
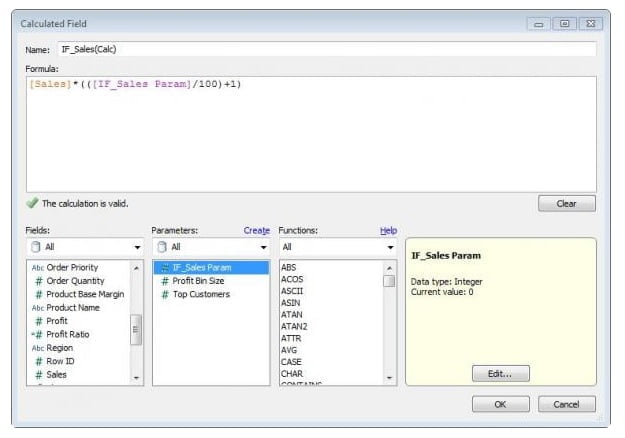
Note: Check how the parameter we generated will interact with the Sales Measure in the calculation.
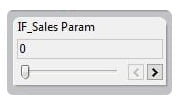
Step 4: Controlling Parameters
When you return to the Tableau main view, you will see the parameter in the Data Window’s Parameters pane and your Calculated field in the Measures pane.
- Select the IF Sales Param parameter.
- Pick the Show Parameter Control option.
- The Parameter Control Filter will be visible at the top right of your view.
Step 5: Use Tableau Parameters in Your Visualization
- Drag and drop the Calculated Field IF_Sales(Calc) onto your Sales Axis. You’ll see an equal symbol that is transparent when you hover over it.
- Following the drop, you’ll see that Measure Names has been added to your Color Shelf and that a Colour Legend now displays both Sales and IF_Sales.
- Your lines are stacked on top of one another since your parameter control is set to 0.
- Once you click on your parameter control, the two lines will show up.
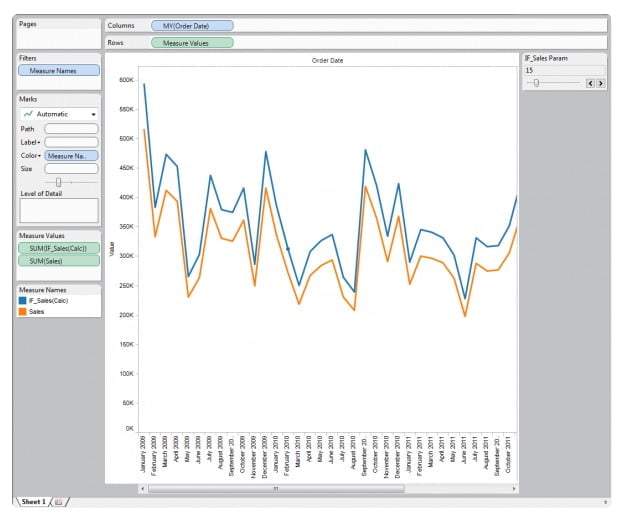
These lines display the concurrent running values of your dataset’s sales and your calculated sales. And your visualization effectively incorporates your parameters!
You can utilize dynamic parameters in a report to increase its flexibility and interaction. It is a flexible tool that works well for both calculations and sets!
Conclusion
Interested in learning more about parameters in Tableau? You should enroll in Softlogic’s Tableau Certification Training. It matched the requirements of the Tableau Associate Level Certification Exam.
It has been carefully selected to assist analytics and data professionals in building intelligent dashboards, performing scripting, and building network diagrams on Tableau to show the data in a much more illuminating way.